


Crude Oil slips from a one-month high on Trump's Russia waiver
- WTI is set to end a seven-session winning streak within Friday's range.
- The waiver lifts tariffs of up to 100% on the biggest buyers of Russian energy.
- The EIA's US inventory count is due Wednesday after an 8.6 million barrel fall.
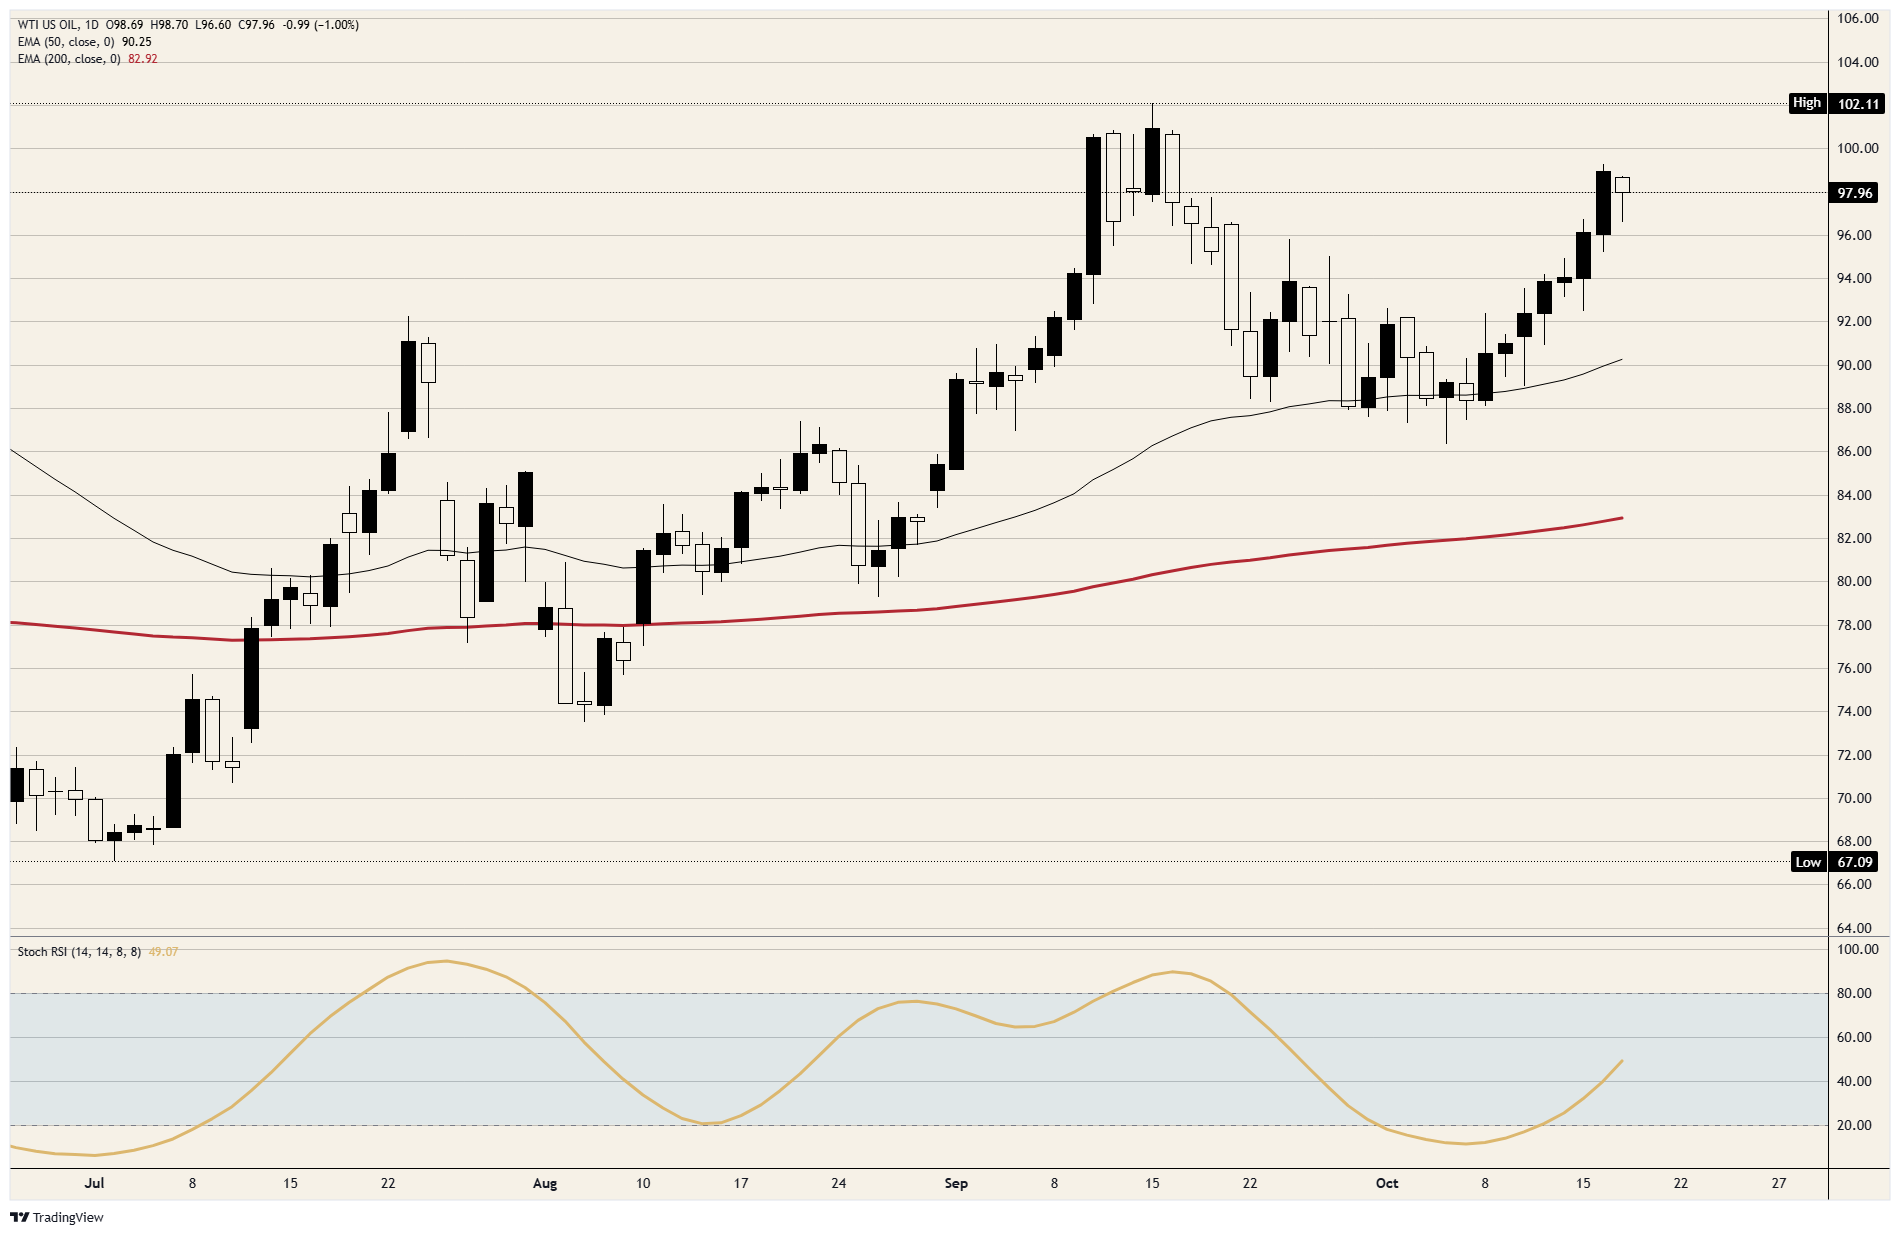
A waiver of new Russia sanctions has WTI on track for its first losing session in eight, though the price hasn't left Friday's range. Friday's high just above $99.00 was the highest since mid-September. The session low just above $96.50 gave back about a fifth of the seven-session climb, and the price is back near $98.00.
President Trump signed an order on Friday waiving the Russia sections of the Graham Act, including tariffs of up to 100% on the five biggest buyers of Russian Crude Oil. Russia supplied nearly half of India's Crude Oil imports earlier this year, and under the tariffs India would have had to replace them, US Crude Oil included. The act became law in September after an 86-11 Senate vote, and its Russia sections were waived before they came into force.
Kpler put the seven-day average of Gulf Crude Oil flows near 8.5 million barrels a day, from more than 20 million a week earlier. Iran's Revolutionary Guard said a tanker hit a mine in the southern Strait of Hormuz on Sunday. WTI loads at Texas ports, so a buyer short of Gulf cargoes can replace them with barrels that never go near the strait.
On the calendar
The American Petroleum Institute (API) publishes its US inventory count at 20:30 GMT on Tuesday, and the Energy Information Administration (EIA) follows at 14:30 GMT on Wednesday. The EIA's figures cover the week to October 16, the first US count from the week Gulf flows fell, after commercial stocks dropped 8.6 million barrels the week before.
Secretary of State Rubio meets Indian External Affairs Minister Jaishankar in Mumbai on Tuesday. He said on Monday that their trade deal, which he called very close, was one reason for Friday's waiver, and India's Russian cargoes are the ones the waived tariffs were written for.
On the charts
The seven-session run began from a close just under the 50-day Exponential Moving Average (EMA) on October 7, and the average has risen to just above $90.00 since. At its Friday high the price had recovered more than four-fifths of the fall from the September 15 high just above $102.00 to the October 6 low near $86.50.
WTI spot daily chart
WTI Oil FAQs
WTI Oil is a type of Crude Oil sold on international markets. The WTI stands for West Texas Intermediate, one of three major types including Brent and Dubai Crude. WTI is also referred to as “light” and “sweet” because of its relatively low gravity and sulfur content respectively. It is considered a high quality Oil that is easily refined. It is sourced in the United States and distributed via the Cushing hub, which is considered “The Pipeline Crossroads of the World”. It is a benchmark for the Oil market and WTI price is frequently quoted in the media.
Like all assets, supply and demand are the key drivers of WTI Oil price. As such, global growth can be a driver of increased demand and vice versa for weak global growth. Political instability, wars, and sanctions can disrupt supply and impact prices. The decisions of OPEC, a group of major Oil-producing countries, is another key driver of price. The value of the US Dollar influences the price of WTI Crude Oil, since Oil is predominantly traded in US Dollars, thus a weaker US Dollar can make Oil more affordable and vice versa.
The weekly Oil inventory reports published by the American Petroleum Institute (API) and the Energy Information Agency (EIA) impact the price of WTI Oil. Changes in inventories reflect fluctuating supply and demand. If the data shows a drop in inventories it can indicate increased demand, pushing up Oil price. Higher inventories can reflect increased supply, pushing down prices. API’s report is published every Tuesday and EIA’s the day after. Their results are usually similar, falling within 1% of each other 75% of the time. The EIA data is considered more reliable, since it is a government agency.
OPEC (Organization of the Petroleum Exporting Countries) is a group of 12 Oil-producing nations who collectively decide production quotas for member countries at twice-yearly meetings. Their decisions often impact WTI Oil prices. When OPEC decides to lower quotas, it can tighten supply, pushing up Oil prices. When OPEC increases production, it has the opposite effect. OPEC+ refers to an expanded group that includes ten extra non-OPEC members, the most notable of which is Russia.
추천 기사


