
Gold remains close to all-time high amid Fed rate cut bets and geopolitical risks
- Gold attracts dip-buyers on Wednesday and stalls the overnight pullback from the all-time peak.
- Fed rate cut bets and geopolitical uncertainty continue to act as a tailwind for the precious metal.
- A modest USD uptick might cap gains for the XAU/USD pair amid extremely overbought conditions.
Gold (XAU/USD) reverses a modest Asian session dip to the $3,750 area and, for now, seems to have stalled its retracement slide from the all-time peak touched the previous day. Expectations for further interest rate cuts by the Federal Reserve (Fed), along with geopolitical uncertainties stemming from the intensifying Russia-Ukraine war and conflicts in the Middle East, continue to act as a tailwind for the precious metal. Apart from this, a slight deterioration in the global risk sentiment turns out to be another factor lending support to the safe-haven commodity.
Meanwhile, the US Dollar (USD) gains some positive traction and snaps a two-day losing streak in the wake of Fed Chair Jerome Powell's cautious remarks on potential interest rate cuts. This might hold back traders from placing fresh bullish bets around the non-yielding Gold amid still overbought conditions. Nevertheless, the supportive fundamental backdrop suggests that the path of least resistance for the XAU/USD pair remains to the upside as the market focus now shifts to the release of the US Personal Consumption Expenditure (PCE) Price Index on Friday.
Daily Digest Market Movers: Gold bulls retain control amid a supportive fundamental backdrop
- Traders expect the US Federal Reserve to lower borrowing costs again in October and December following a 25 basis points rate cut earlier this month. This assists the non-yielding Gold to attract some dip-buying during the Asian session on Wednesday.
- Chair Jerome Powell tried to push back expectations of more rate cuts in the coming months and said on Tuesday that the central bank needed to continue balancing the competing risks of high inflation and a weakening job market in coming rate decisions.
- Powell added that easing too aggressively could leave the inflation job unfinished and need to reverse course. This helps revive the US Dollar demand following a two-day retracement slide from an over one-week high and might cap the precious metal.
- NATO warned Russia on Tuesday that it would use all necessary military and non-military tools to defend itself. This follows Russia's recent large-scale provocation and the violation of the airspace of NATO alliance members – Estonia, Poland, and Romania.
- Meanwhile, Israel continues with its military assault across Gaza. A newly released UN report found that the Israeli government has shown a clear intent to establish permanent control over Gaza and ensure a Jewish majority in the occupied West Bank.
- This fuels concerns about a broader regional conflict in the Middle East and keeps geopolitical risks in play, which turns out to be another factor offering support to the safe-haven commodity. Traders now look to New Home Sales data from the US for a fresh impetus.
- This week's US economic docket also features the final Q2 GDP and Durable Goods Orders on Thursday, followed by the US Personal Consumption Expenditure (PCE) Price Index on Friday. The data will drive the USD and the XAU/USD pair in the near term.
Gold needs to find acceptance above $3,800 to back the case for a further move higher
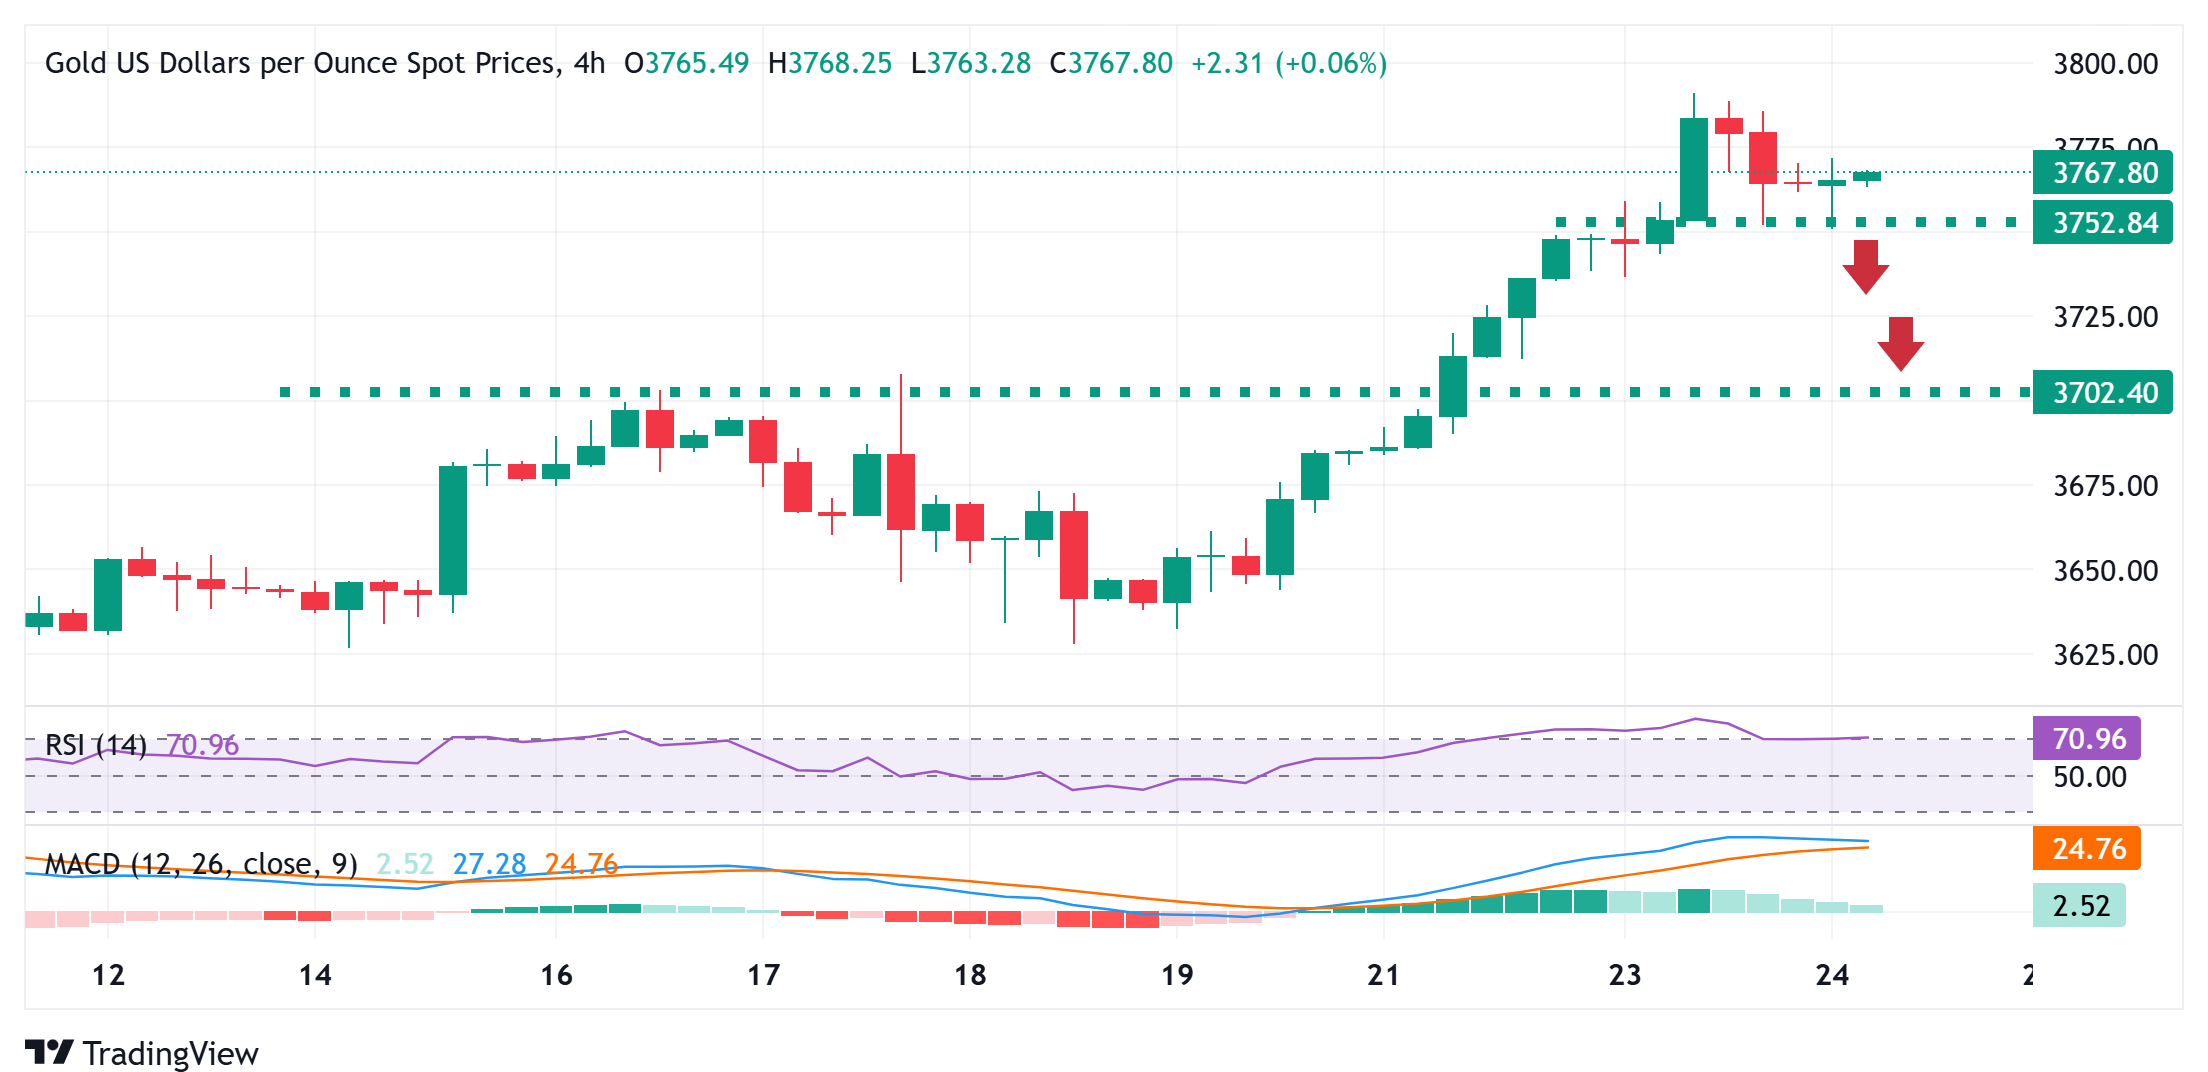
The recent blowout rally has defied overbought conditions, and the emergence of some dip-buying on Wednesday suggests that the path of least resistance for the Gold price remains to the upside. However, the overnight failure ahead of the $3,800 mark could be seen as the first sign of a possible bullish exhaustion. Hence, some follow-through selling below the Asian session low, around the $3,750 area, could expose the $3,710-$3,700 support zone.
The latter should act as a strong base for the Gold price, which, if broken decisively, should pave the way for deeper losses. The XAU/USD bulls, meanwhile, might now wait for a sustained move and acceptance above the $3,800 round figure before positioning for an extension of the recent well-established uptrend witnessed over the past month or so.
US Dollar Price Today
The table below shows the percentage change of US Dollar (USD) against listed major currencies today. US Dollar was the strongest against the Japanese Yen.
| USD | EUR | GBP | JPY | CAD | AUD | NZD | CHF | |
|---|---|---|---|---|---|---|---|---|
| USD | 0.13% | 0.15% | 0.22% | 0.07% | -0.39% | -0.04% | 0.12% | |
| EUR | -0.13% | 0.00% | 0.09% | -0.07% | -0.53% | -0.18% | -0.01% | |
| GBP | -0.15% | -0.01% | 0.06% | -0.08% | -0.47% | -0.19% | -0.07% | |
| JPY | -0.22% | -0.09% | -0.06% | -0.17% | -0.60% | -0.35% | -0.12% | |
| CAD | -0.07% | 0.07% | 0.08% | 0.17% | -0.42% | -0.12% | 0.03% | |
| AUD | 0.39% | 0.53% | 0.47% | 0.60% | 0.42% | 0.35% | 0.54% | |
| NZD | 0.04% | 0.18% | 0.19% | 0.35% | 0.12% | -0.35% | 0.19% | |
| CHF | -0.12% | 0.01% | 0.07% | 0.12% | -0.03% | -0.54% | -0.19% |
The heat map shows percentage changes of major currencies against each other. The base currency is picked from the left column, while the quote currency is picked from the top row. For example, if you pick the US Dollar from the left column and move along the horizontal line to the Japanese Yen, the percentage change displayed in the box will represent USD (base)/JPY (quote).
추천 기사


