
AUD/USD slips from YTD high as stronger US Dollar and wedge rejection weigh on outlook
- AUD/USD slips from YTD high as rising US yields lift demand for the US Dollar.
- US Dollar gains traction on trade optimism and steady Fed expectations.
- AUD/USD rejection at wedge resistance raises downside risks below 0.6600.
The Australian Dollar (AUD) is losing ground against the US Dollar (USD) on Friday, pressured by rising US Treasury yields that continue to support demand for the Greenback.
After climbing to a year-to-date high of 0.6625 on Thursday, AUD/USD has slipped, trading below 0.6600 at the time of writing.
Market sentiment toward the US Dollar has improved. While President Donald Trump continues to criticize the Federal Reserve (Fed) for not cutting rates, his reassurance that Chair Jerome Powell will remain in his position has helped ease investor concerns.
That, combined with encouraging trade developments and resilient US economic data, has kept upward momentum behind the USD.
Attention is now shifting to upcoming trade negotiations and central bank decisions.
Talks between US Treasury Secretary Scott Bessent and Chinese officials are set to begin Sunday in Stockholm and will run through Tuesday, with both sides aiming to build on the current trade agreement. Meanwhile, investors are also eyeing signs of progress in potential trade discussions between the US and the EU.
Looking ahead, next week’s focus will turn to the Fed’s rate decision on Wednesday. Markets broadly expect the Fed to hold rates steady within the 4.25%–4.50% range.
AUD/USD technical analysis: Rejection at resistance raises downside risks
As for the AUD/USD pair, part of the recent pullback may be driven by profit-taking after the sharp rally.
On the daily chart, price action remains contained within an ascending wedge pattern. Thursday’s move to 0.6625 marked an eight-month high, touching resistance at the top of the wedge. However, the pair failed to break higher, prompting sellers to step in.
The rejection at the recent high is technically significant. Thursday’s candle shows a long upper wick, signaling fading bullish momentum. The current session is forming a full-bodied bearish candle, reinforcing the reversal and suggesting the possibility of further downside.
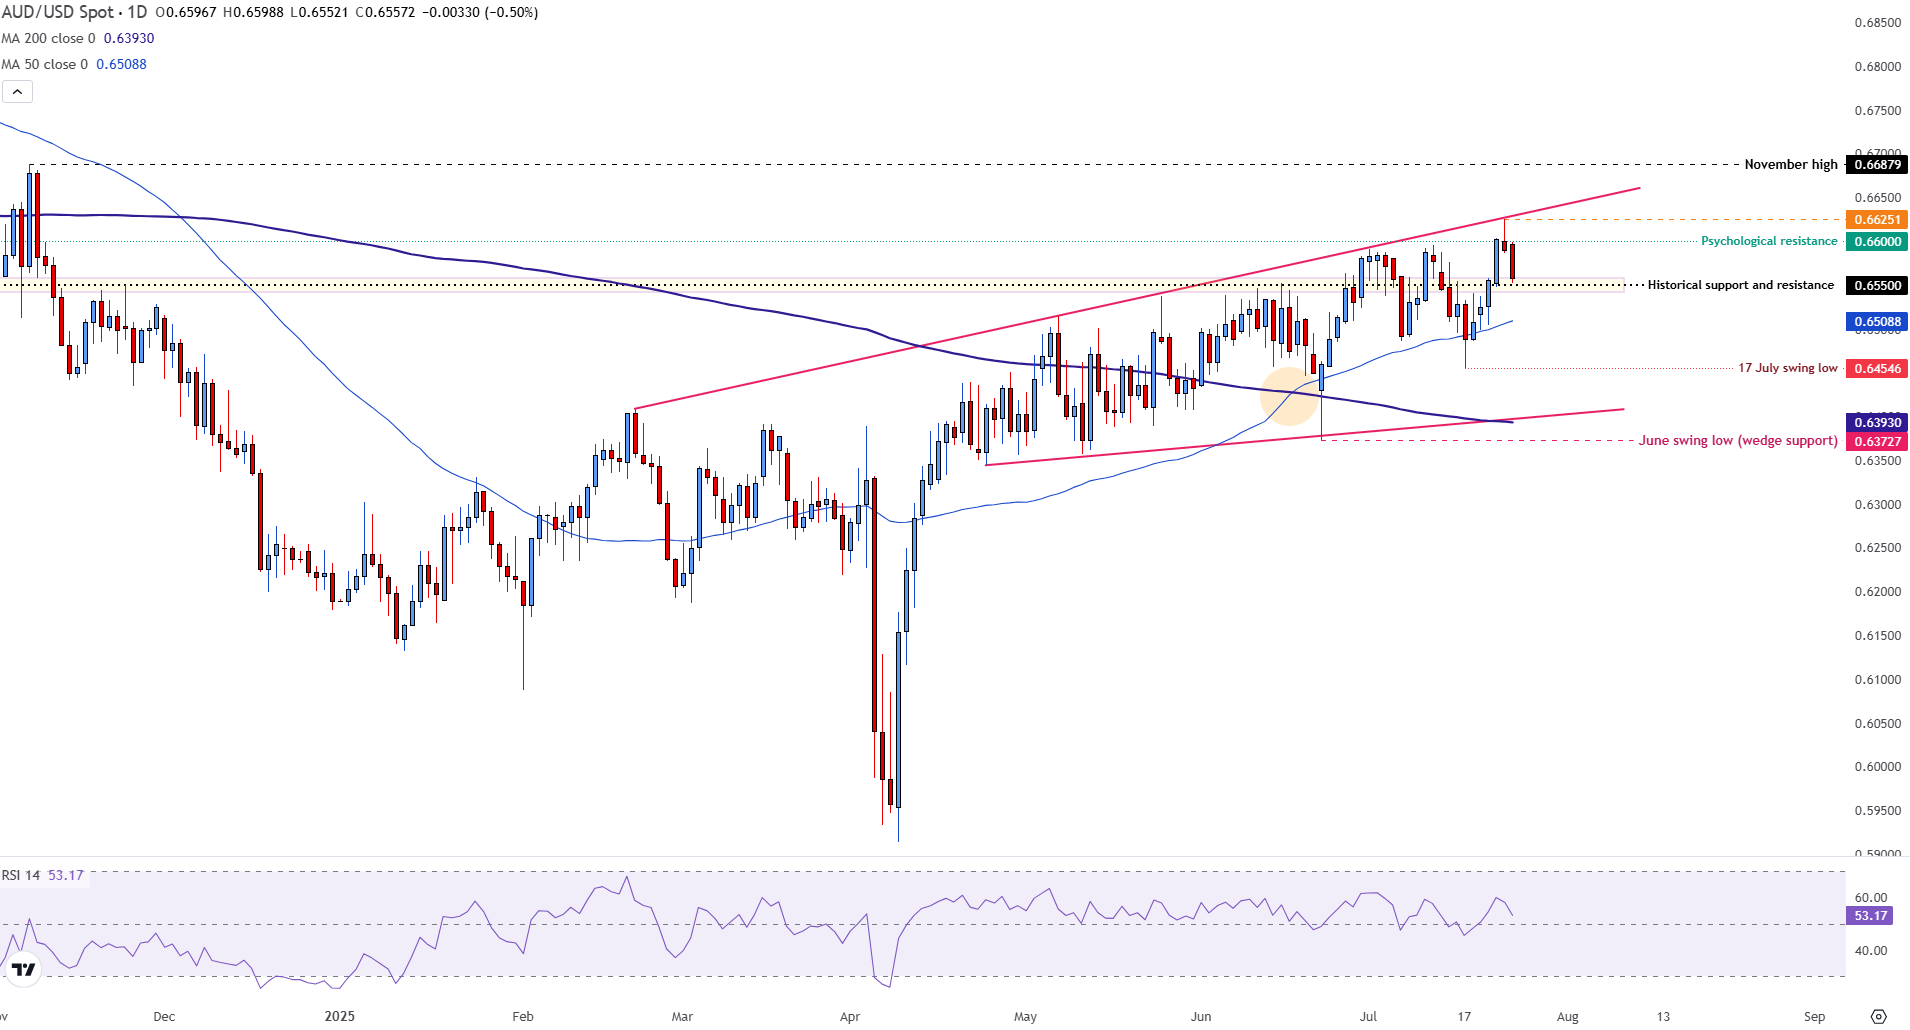
AUD/USD daily chart
For bears to build momentum and shift the trend, initial support lies at 0.6550, a prior resistance level now acting as horizontal support.
A break below this would bring the 50-day Simple Moving Average (SMA) into focus at 0.6508, followed by the July swing low at 0.6454.
If downside pressure deepens, the next levels to watch are the 200-day SMA near 0.6393 and the June swing low, which aligns with rising wedge support at 0.6372.
On the bullish side, a decisive close above 0.6625 would indicate a breakout from the wedge pattern, opening the door for further gains toward the November high at 0.6687.
US Dollar FAQs
The US Dollar (USD) is the official currency of the United States of America, and the ‘de facto’ currency of a significant number of other countries where it is found in circulation alongside local notes. It is the most heavily traded currency in the world, accounting for over 88% of all global foreign exchange turnover, or an average of $6.6 trillion in transactions per day, according to data from 2022. Following the second world war, the USD took over from the British Pound as the world’s reserve currency. For most of its history, the US Dollar was backed by Gold, until the Bretton Woods Agreement in 1971 when the Gold Standard went away.
The most important single factor impacting on the value of the US Dollar is monetary policy, which is shaped by the Federal Reserve (Fed). The Fed has two mandates: to achieve price stability (control inflation) and foster full employment. Its primary tool to achieve these two goals is by adjusting interest rates. When prices are rising too quickly and inflation is above the Fed’s 2% target, the Fed will raise rates, which helps the USD value. When inflation falls below 2% or the Unemployment Rate is too high, the Fed may lower interest rates, which weighs on the Greenback.
In extreme situations, the Federal Reserve can also print more Dollars and enact quantitative easing (QE). QE is the process by which the Fed substantially increases the flow of credit in a stuck financial system. It is a non-standard policy measure used when credit has dried up because banks will not lend to each other (out of the fear of counterparty default). It is a last resort when simply lowering interest rates is unlikely to achieve the necessary result. It was the Fed’s weapon of choice to combat the credit crunch that occurred during the Great Financial Crisis in 2008. It involves the Fed printing more Dollars and using them to buy US government bonds predominantly from financial institutions. QE usually leads to a weaker US Dollar.
Quantitative tightening (QT) is the reverse process whereby the Federal Reserve stops buying bonds from financial institutions and does not reinvest the principal from the bonds it holds maturing in new purchases. It is usually positive for the US Dollar.
추천 기사


