
USD/CAD Price Forecast: A downside move to near 1.3400 seems warranted
- USD/CAD wobbles near an almost three-week low around 1.3600 ahead of flash US PMI and Canadian Retail Sales data.
- Market sentiment improves on hopes that the US and the EU are close to finalize a tariff deal.
- USD/CAD trades below the 20-day EMA, signaling a downside trend.
The USD/CAD pair clings to losses near an almost three-week low around 1.3600 during the Asian trading session on Thursday. The Loonie pair faces selling pressure as the safe-haven demand of the US Dollar (USD) has diminished amid hopes that the United States (US) and the European Union (EU) will strike a trade agreement ahead of the August 1 tariff deadline.
At the time of writing, the US Dollar Index (DXY), which tracks the Greenback’s value against six major currencies, seems vulnerable near the two-week low around 97.00.
Investors turn increasingly confident that economies on both sides of the Atlantic could finalize an agreement, which would be similar to the tariff deal took place between US and Japan on Tuesday. This means that Washington has offered a reduction in the baseline tariff and automobile levy to 15%.
Meanwhile, investors await the flash US S&P Global PMI data for July, which will be published at 13:45 GMT.
In Canada, investors will focus on the monthly Retail Sales data for May, which will be published at 12:30 GMT. The Retail Sales data is expected to have declined by 1.1% after a nominal growth of 0.3% in April.
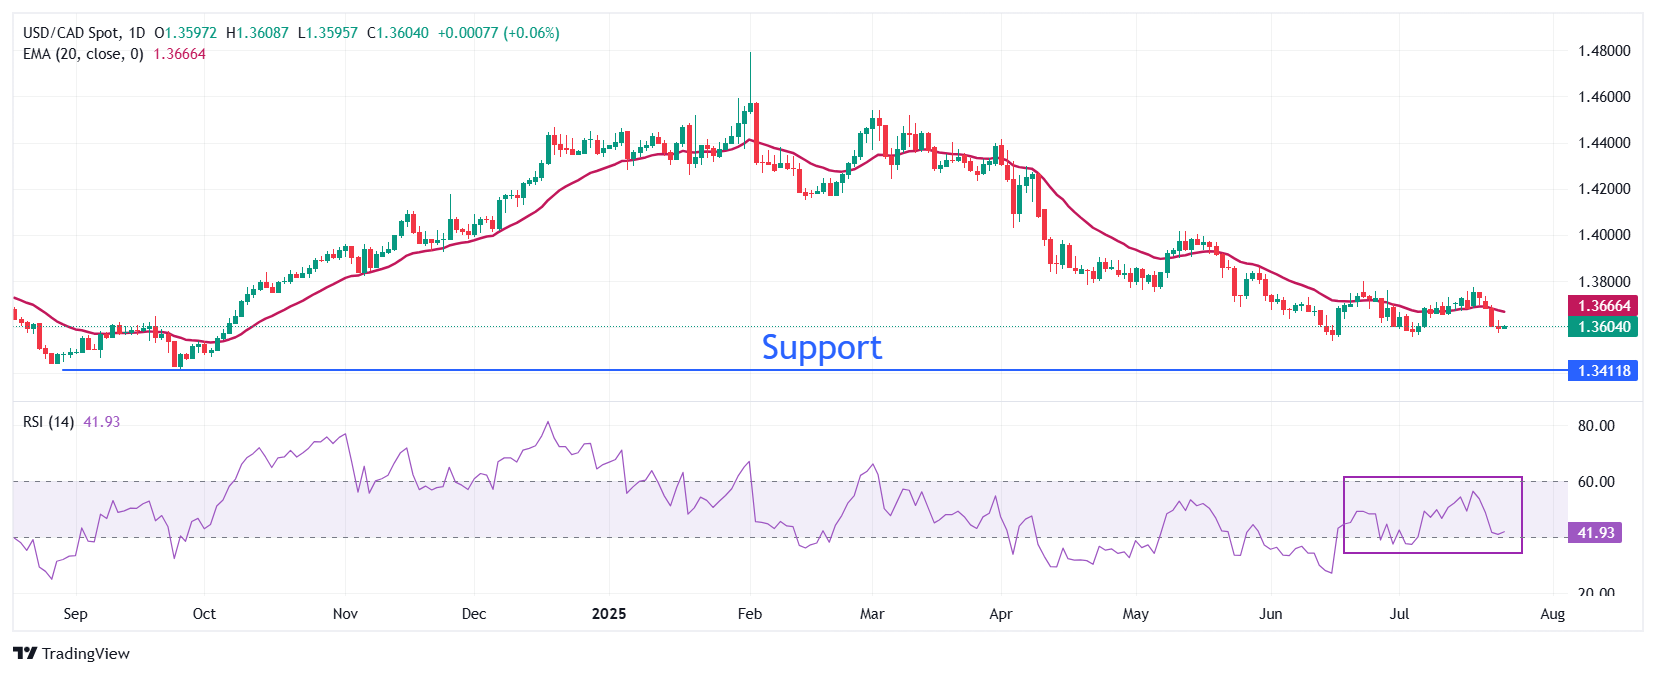
USD/CAD exhibits volatility contraction around 1.3600, oscillating inside Wednesday’s trading range. The near-term trend of the pair remains bearish as the 20-day Exponential Moving Average (EMA) slopes downwards to near 1.3666.
The 14-day Relative Strength Index (RSI) slides to near 40.00. A fresh downside momentum would trigger if the RSI falls below that level.
The asset could slide towards the psychological level of 1.3500 and the September 25 low of 1.3420 if it breaks below the June 16 low of 1.3540.
On the contrary, an upside move by the pair above the May 29 high of 1.3820 would open the door towards the May 21 high of 1.3920, followed by the May 15 high of 1.4000.
USD/CAD daily chart
US Dollar FAQs
The US Dollar (USD) is the official currency of the United States of America, and the ‘de facto’ currency of a significant number of other countries where it is found in circulation alongside local notes. It is the most heavily traded currency in the world, accounting for over 88% of all global foreign exchange turnover, or an average of $6.6 trillion in transactions per day, according to data from 2022. Following the second world war, the USD took over from the British Pound as the world’s reserve currency. For most of its history, the US Dollar was backed by Gold, until the Bretton Woods Agreement in 1971 when the Gold Standard went away.
The most important single factor impacting on the value of the US Dollar is monetary policy, which is shaped by the Federal Reserve (Fed). The Fed has two mandates: to achieve price stability (control inflation) and foster full employment. Its primary tool to achieve these two goals is by adjusting interest rates. When prices are rising too quickly and inflation is above the Fed’s 2% target, the Fed will raise rates, which helps the USD value. When inflation falls below 2% or the Unemployment Rate is too high, the Fed may lower interest rates, which weighs on the Greenback.
In extreme situations, the Federal Reserve can also print more Dollars and enact quantitative easing (QE). QE is the process by which the Fed substantially increases the flow of credit in a stuck financial system. It is a non-standard policy measure used when credit has dried up because banks will not lend to each other (out of the fear of counterparty default). It is a last resort when simply lowering interest rates is unlikely to achieve the necessary result. It was the Fed’s weapon of choice to combat the credit crunch that occurred during the Great Financial Crisis in 2008. It involves the Fed printing more Dollars and using them to buy US government bonds predominantly from financial institutions. QE usually leads to a weaker US Dollar.
Quantitative tightening (QT) is the reverse process whereby the Federal Reserve stops buying bonds from financial institutions and does not reinvest the principal from the bonds it holds maturing in new purchases. It is usually positive for the US Dollar.
추천 기사


