
Australian Dollar extends winning streak following improved PMI data
- The Australian Dollar has reached a fresh eight-month high of 0.6613 on Thursday.
- S&P Australia’s Composite PMI rose to 53.6 in July, marking the highest level since April 2022.
- US Treasury Secretary Bessent stated that a nominee for the next Fed Chair could be announced in December or January.
The Australian Dollar (AUD) advances against the US Dollar (USD) on Thursday, extending its gains for the fifth consecutive day. The AUD/USD pair is reaching fresh eight-month highs above 0.6600 following the release of Australia's preliminary Judo Bank Purchasing Managers Index (PMI) data. The focus shifts toward the Reserve Bank of Australia (RBA) Governor's speech.
Judo Bank and S&P Global showed that Australia’s Composite PMI rose to 53.6 in July versus 51.6 prior, reaching the highest level since April 2022 and marking the tenth consecutive month of expansion.
Australian Services PMI climbed to 53.8 in July from the previous reading of 51.8, reaching its fastest pace in 16 months. Meanwhile, the Manufacturing PMI came in at 51.6 in July versus 50.6 prior. New orders for manufactured goods rebounded, driving the strongest overall growth in new business in more than three years.
The risk-sensitive AUD/USD pair also receives support from improving market sentiment, driven by the latest trade developments. The Financial Times reported that the European Union (EU) and the United States (US) are closing in on a deal that would impose 15% tariffs on EU goods imported into the US.
Australian Dollar gains ground as US Dollar declines amid risk-on mood
- The US Dollar Index (DXY), which measures the value of the US Dollar against six major currencies, is continuing to lose ground and trading around 97.10 at the time of writing. Investors will likely observe the US S&P Global Purchasing Managers Index (PMI) data for July later on Thursday.
- US Treasury Secretary Scott Bessent said on Thursday that a nominee for the next Federal Reserve Chair is likely to be announced in December or January. Bessent emphasized that there is “no rush” to select a successor to current Fed Chair Jerome Powell, noting that the nominee could come from current board members or the heads of the district banks, according to Bloomberg.
- US President Donald Trump’s announcement of a major tariff deal with Japan, which includes a 15% tariff on Japanese exports. Additionally, talks between the United States (US) and China are gaining momentum ahead of the August 12 deadline.
- President Trump announced a trade deal with Japan that includes a 15% tariff on Japanese exports to the US. As part of the agreement, Japan will invest $550 billion in the US and open its markets to key American products.
- Republican Congresswoman Anna Paulina Luna has formally accused the Fed Chair Powell of committing perjury on two separate occasions, both stemming from discussions about the Fed's long-scheduled renovations to its head offices in Washington, DC.
- Fed Governor Adriana Kugler said that the US central bank should not lower interest rates "for some time" since the effects of Trump administration tariffs are starting to show up in consumer prices. Kugler added that restrictive monetary policy is essential to keep inflationary psychology in line.
- San Francisco Fed President Mary Daly said last week that expecting two rate cuts this year is a "reasonable" outlook, while warning against waiting too long. Daly added that rates would eventually settle at 3% or higher, exceeding the pre-pandemic neutral rate.
- Fed Governor Christopher Waller believes that the US central bank should reduce its interest rate target at the July meeting, citing mounting economic risks. Waller added that delaying cuts runs the risk of needing more aggressive action later.
- US Commerce Secretary Howard Lutnick stated unequivocally in a televised interview, “That’s a hard deadline, so on August 1, the new tariff rates will come in. Nothing stops countries from talking to us after August 1, but they’re going to start paying the tariffs on August 1.”
- The latest Reserve Bank of Australia’s (RBA) Meeting Minutes indicated that the board agreed further rate cuts were warranted over time, with attention centered on timing and extent of easing. The majority believed it was best to await confirmation of an inflation slowdown before easing. Most members felt cutting rates three times in four meetings would not be "cautious and gradual.”
- Westpac reports that its Leading Index continues to reflect weakening momentum. The six-month annualised growth rate in the Westpac-Melbourne Institute Leading Index eased to 0.03% in June, down from 0.11% in May. The slowdown is primarily driven by softer commodity prices, waning sentiment, and reduced hours worked.
Australian Dollar rises above 0.6600 to mark fresh eight-month highs
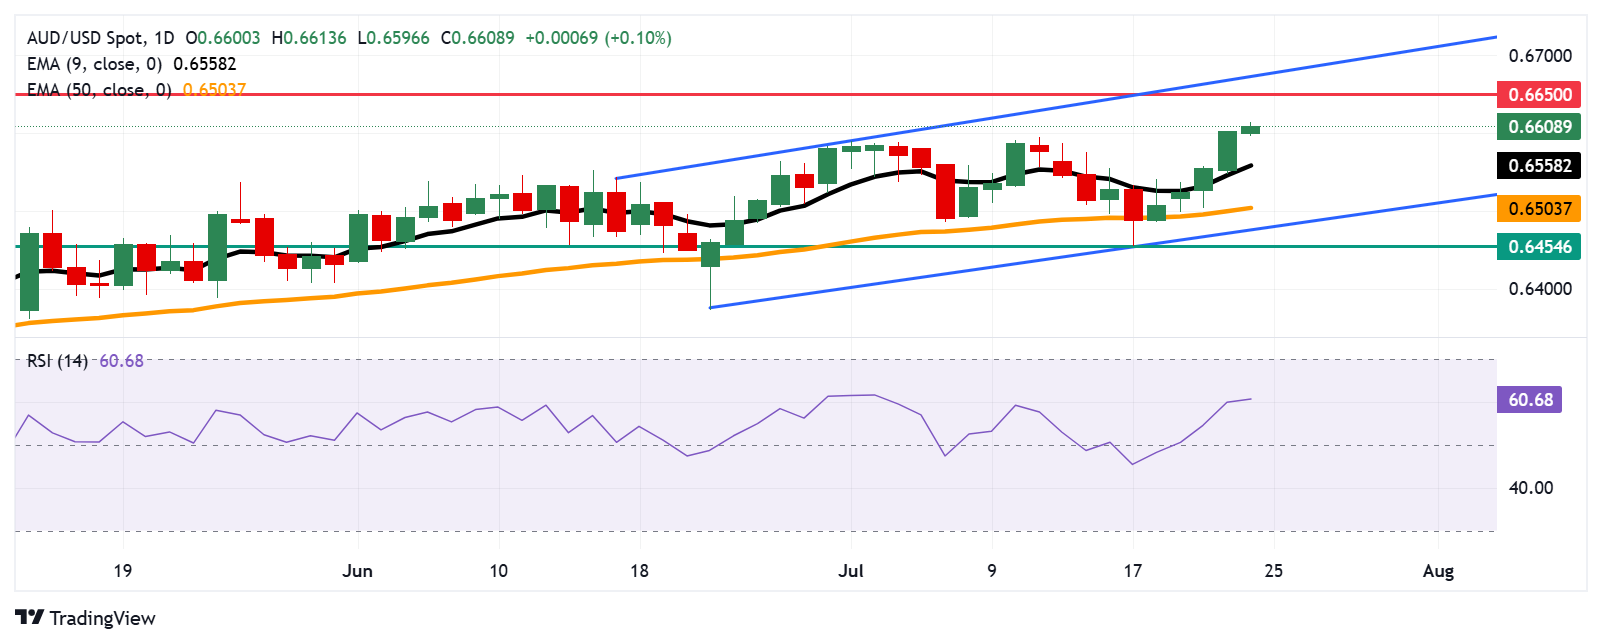
The AUD/USD pair is trading around 0.6610 on Thursday. The daily chart’s technical analysis suggested a persistent bullish bias as the pair moves upwards within the ascending channel pattern. The 14-day Relative Strength Index (RSI) is positioned above the 50 mark, suggesting a bullish bias is active. Additionally, the pair has also moved above the nine-day Exponential Moving Average (EMA), indicating that short-term price momentum is strengthening.
On the upside, the AUD/USD pair may target the psychological level of 0.6650, followed by the ascending channel’s upper boundary around 0.6680.
The AUD/USD pair could find its primary support at nine-day EMA at 0.6558. A break below this level could weaken the short-term price momentum and prompt the pair to test the 50-day EMA of 0.6503. Further declines would weaken the medium-term price momentum and drive the pair to approach the ascending channel’s lower boundary around 0.6480, followed by the three-week low at 0.6454, which was recorded on July 17.
AUD/USD: Daily Chart
Australian Dollar PRICE Today
The table below shows the percentage change of Australian Dollar (AUD) against listed major currencies today. Australian Dollar was the strongest against the Canadian Dollar.
| USD | EUR | GBP | JPY | CAD | AUD | NZD | CHF | |
|---|---|---|---|---|---|---|---|---|
| USD | -0.04% | -0.03% | -0.39% | 0.05% | -0.12% | -0.12% | -0.09% | |
| EUR | 0.04% | 0.02% | -0.36% | 0.09% | -0.07% | -0.08% | -0.04% | |
| GBP | 0.03% | -0.02% | -0.40% | 0.08% | -0.09% | -0.10% | -0.07% | |
| JPY | 0.39% | 0.36% | 0.40% | 0.46% | 0.27% | 0.22% | 0.18% | |
| CAD | -0.05% | -0.09% | -0.08% | -0.46% | -0.14% | -0.18% | -0.15% | |
| AUD | 0.12% | 0.07% | 0.09% | -0.27% | 0.14% | -0.01% | 0.03% | |
| NZD | 0.12% | 0.08% | 0.10% | -0.22% | 0.18% | 0.00% | 0.03% | |
| CHF | 0.09% | 0.04% | 0.07% | -0.18% | 0.15% | -0.03% | -0.03% |
The heat map shows percentage changes of major currencies against each other. The base currency is picked from the left column, while the quote currency is picked from the top row. For example, if you pick the Australian Dollar from the left column and move along the horizontal line to the US Dollar, the percentage change displayed in the box will represent AUD (base)/USD (quote).
Economic Indicator
S&P Global Composite PMI
The Composite Purchasing Managers Index (PMI), released on a monthly basis by S&P Global, is a leading indicator gauging private-business activity in Australia for both the manufacturing and services sectors. The data is derived from surveys to senior executives. Each response is weighted according to the size of the company and its contribution to total manufacturing or services output accounted for by the sub-sector to which that company belongs. Survey responses reflect the change, if any, in the current month compared to the previous month and can anticipate changing trends in official data series such as Gross Domestic Product (GDP), industrial production, employment and inflation. The index varies between 0 and 100, with levels of 50.0 signaling no change over the previous month. A reading above 50 indicates that the Australian private economy is generally expanding, a bullish sign for the Australian Dollar (AUD). Meanwhile, a reading below 50 signals that activity is generally declining, which is seen as bearish for AUD.
Read more.Last release: Wed Jul 23, 2025 23:00 (Prel)
Frequency: Monthly
Actual: 53.6
Consensus: -
Previous: 51.6
Source: S&P Global
추천 기사


