

EUR/USD falls back as US CPI inflation data prints above expectations
- EUR/USD tested lower on Thursday, finding the 200-day EMA.
- Euro data remains thin this week, leaving Fiber to churn on US data.
- Coming up on Friday: US PPI inflation, UoM consumer sentiment figures.
EUR/USD managed to maintain a finger grip on chart paper north of the 1.9000 handle. Fiber wound up closing lower, but recovered just enough to pull back from a deeper test of the 200-day Exponential Moving Average (EMA) near the 1.0900 handle.
Headline US CPI inflation fell less than expected through the year ended in September, declining from 2.5% to 2.4%. Median market forecasts had called for a print of 2.4% YoY. On the other hand, core US CPI inflation ticked higher YoY in September, rising to 3.3% from the previous 3.2%.
US Initial Jobless Claims unexpectedly rose for the week ended October 4, climbing to 258K week-on-week and clipping the highest rate of new jobless benefits seekers since June of 2023.
Mixed rate-impacting data flummoxed rate markets on Thursday. Rising unemployment figures bolster hopes for rate cuts as the Federal Reserve (Fed) looks to keep the US labor market afloat, while still-hot inflation makes it harder for investors to expect a faster pace and depth of rate trims.
Meaningful European economic data points are almost entirely absent on Friday, leaving Fiber traders at the mercy of overall Greenback flows to wrap up the trading week.
US Producer Price Index (PPI) inflation will follow up during the US market session. September’s core PPI print for the year ended in September is expected to accelerate to 2.7% YoY from last month’s 2.4%.
University of Michigan 5-year Consumer Inflation Expectations for October will also print on Friday, alongside the UoM Consumer Sentiment Index. The UoM sentiment index is expected to grind higher to 70.8 from 70.1, while 5-year consumer sentiment expectations were unable to price out a forecast, though the indicator did move higher in the previous month.
EUR/USD price forecast
The EUR/USD pair is trading around 1.09343, experiencing a slight decline of 0.05% for the day as selling pressure continues to weigh on the currency pair. The price action is testing the 200-day Exponential Moving Average (EMA) at 1.09036, a critical level of support that could determine the pair’s next directional move. A break below this level could accelerate downside momentum, potentially opening the door to further declines toward the 1.08500 level, a key psychological barrier. The 50-day EMA, currently at 1.10289, has now become a resistance level after the recent bearish break below it.
The overall trend seems to be shifting towards a more bearish outlook in the short term. The steep decline from the recent highs near 1.1200 indicates that bullish momentum has largely faded. The price has consistently printed lower highs and lower lows, signaling a clear downtrend. Traders will likely keep an eye on how the pair reacts around the 200-day EMA in the coming sessions, as a sustained move below this level could confirm a broader shift in market sentiment toward the downside.
In the broader context, the EUR/USD's price action reflects a market that is increasingly sensitive to economic data releases and central bank decisions. The pair's recent decline coincides with a stronger U.S. dollar, driven by expectations of tighter monetary policy from the Federal Reserve. Eurozone economic data, such as inflation and growth figures, will be key in determining whether the euro can find support at current levels or if further downside risks will materialize. Traders should watch for any signs of reversal, but for now, the technical setup points toward additional weakness.
EUR/USD daily chart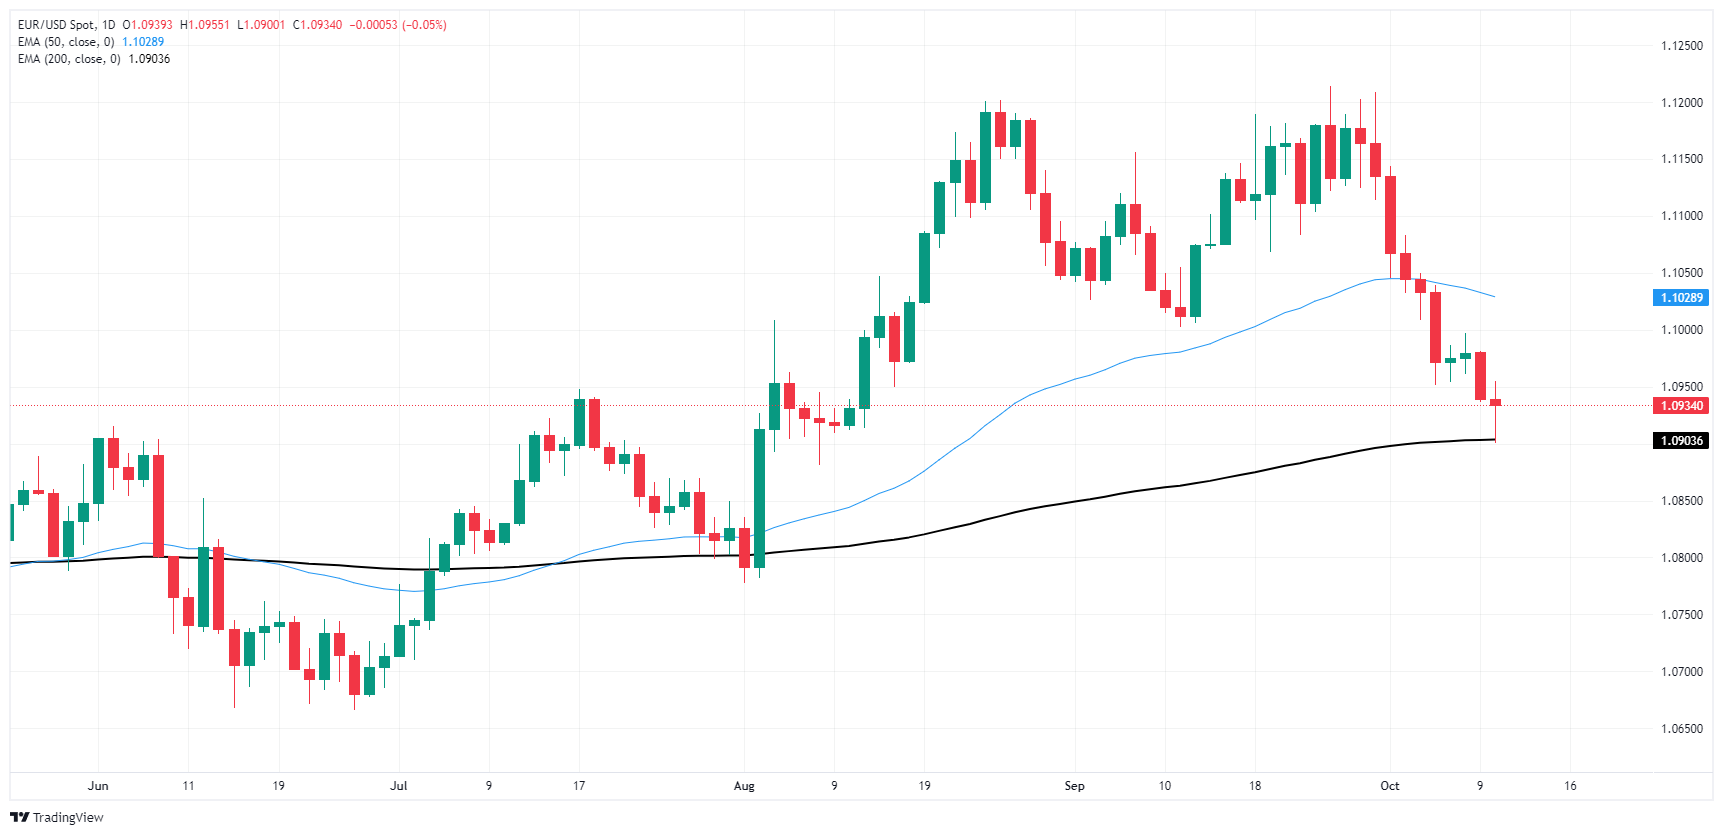
Euro FAQs
The Euro is the currency for the 19 European Union countries that belong to the Eurozone. It is the second most heavily traded currency in the world behind the US Dollar. In 2022, it accounted for 31% of all foreign exchange transactions, with an average daily turnover of over $2.2 trillion a day. EUR/USD is the most heavily traded currency pair in the world, accounting for an estimated 30% off all transactions, followed by EUR/JPY (4%), EUR/GBP (3%) and EUR/AUD (2%).
The European Central Bank (ECB) in Frankfurt, Germany, is the reserve bank for the Eurozone. The ECB sets interest rates and manages monetary policy. The ECB’s primary mandate is to maintain price stability, which means either controlling inflation or stimulating growth. Its primary tool is the raising or lowering of interest rates. Relatively high interest rates – or the expectation of higher rates – will usually benefit the Euro and vice versa. The ECB Governing Council makes monetary policy decisions at meetings held eight times a year. Decisions are made by heads of the Eurozone national banks and six permanent members, including the President of the ECB, Christine Lagarde.
Eurozone inflation data, measured by the Harmonized Index of Consumer Prices (HICP), is an important econometric for the Euro. If inflation rises more than expected, especially if above the ECB’s 2% target, it obliges the ECB to raise interest rates to bring it back under control. Relatively high interest rates compared to its counterparts will usually benefit the Euro, as it makes the region more attractive as a place for global investors to park their money.
Data releases gauge the health of the economy and can impact on the Euro. Indicators such as GDP, Manufacturing and Services PMIs, employment, and consumer sentiment surveys can all influence the direction of the single currency. A strong economy is good for the Euro. Not only does it attract more foreign investment but it may encourage the ECB to put up interest rates, which will directly strengthen the Euro. Otherwise, if economic data is weak, the Euro is likely to fall. Economic data for the four largest economies in the euro area (Germany, France, Italy and Spain) are especially significant, as they account for 75% of the Eurozone’s economy.
Another significant data release for the Euro is the Trade Balance. This indicator measures the difference between what a country earns from its exports and what it spends on imports over a given period. If a country produces highly sought after exports then its currency will gain in value purely from the extra demand created from foreign buyers seeking to purchase these goods. Therefore, a positive net Trade Balance strengthens a currency and vice versa for a negative balance.
추천 기사


