


EUR/GBP Price Forecast: Holds a tight range after five consecutive weekly losses
- EUR/GBP trades flat as the Pound struggles to capitalise on the BoE's hawkish rate hike.
- The cross remains below key daily SMAs, keeping the broader bearish bias intact.
- RSI signals oversold conditions, while elevated ADX points to a strong downtrend.
EUR/GBP trades flat on Friday, consolidating within the tight range seen so far this week. The subdued price action suggests bears are taking a breather after five consecutive weekly losses that pushed the cross into oversold territory. At the time of writing, EUR/GBP trades around 0.8339, near levels last seen in April 2025.
The Bank of England’s (BoE) decision to raise interest rates by 25 basis points to 4% on Thursday drew little market reaction, even as policymakers signalled that further hikes may be needed to contain inflation. However, concerns over France’s fiscal outlook continue to favour the Pound over the Euro (EUR).
Pound struggles to hold gains despite BoE hawkishness
Analysts at Commerzbank note that, “despite this rather hawkish decision, the Pound only benefited briefly and had to give up its gains as the day progressed.” They acknowledge that “at first glance, this may seem confusing,” but point out that “expectations ahead of the meeting were quite ambitious, with almost three further rate rises priced in by the middle of next year.” In addition, Governor Andrew Bailey “gave no indication of the timetable following the next rate rise,” limiting the market’s ability to price a clearer path for policy.
Against that backdrop, Commerzbank stress that “we remain firmly of the view that the BoE will not deliver a second interest rate rise until February rather than in December, as this would contradict its cautious approach to date.” They add that “if the situation in the Middle East has stabilised by then and energy exports have normalised, the case for further interest rate hikes will be weaker.” In their view, “until then, the Pound is likely to struggle to trade any higher.”
Technical analysis
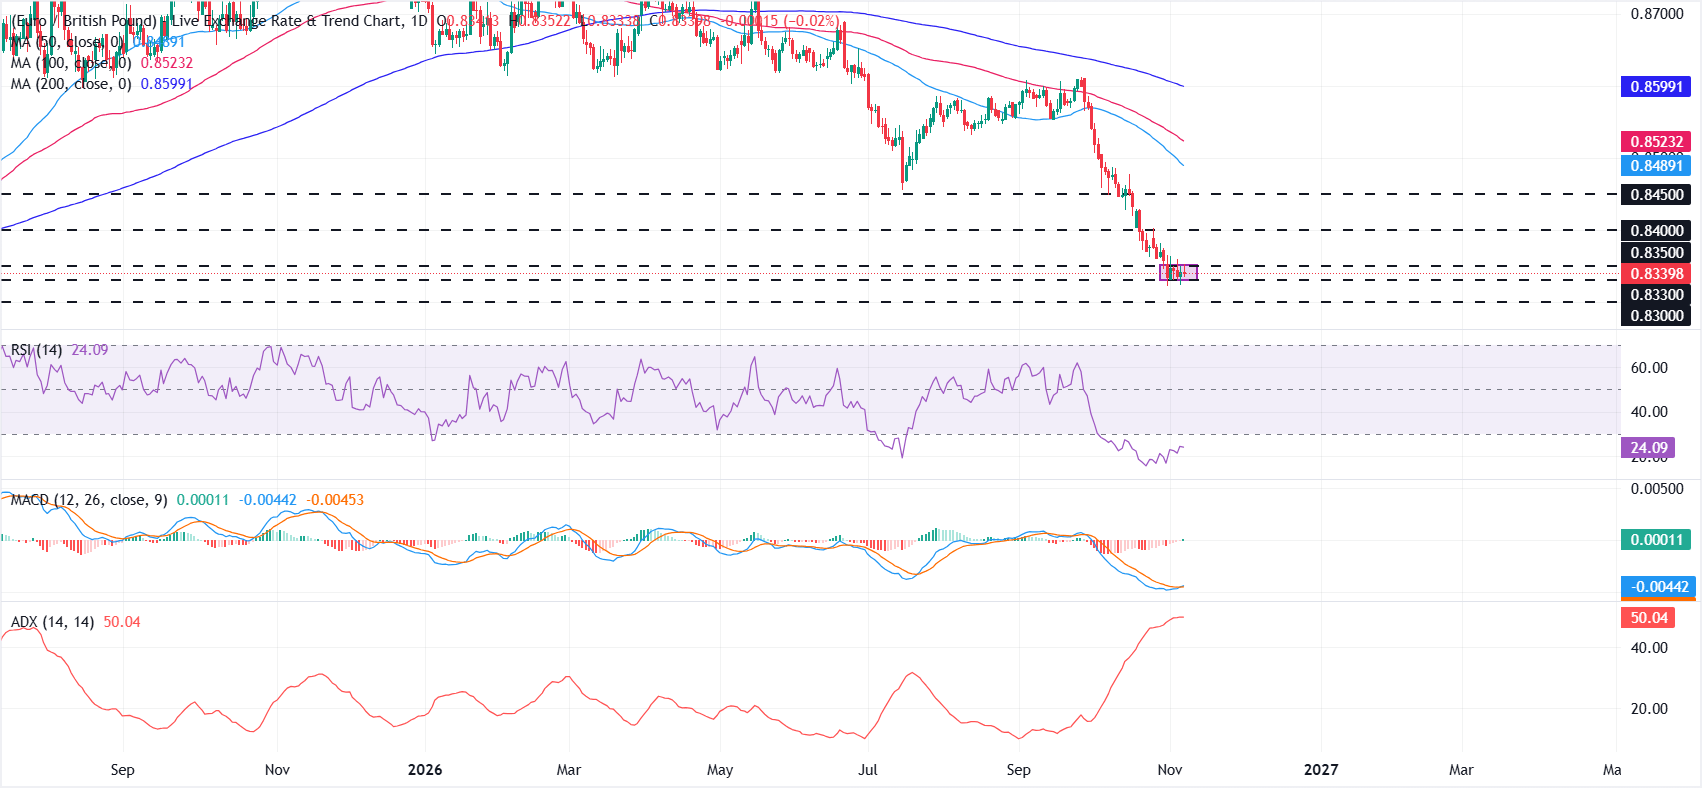
On the daily chart, EUR/GBP maintains a bearish near-term tone as it trades below the 50-, 100- and 200-day Simple Moving Averages (SMAs), clustered between roughly 0.8489and 0.8599.
The Relative Strength Index (RSI) languishes around 24, flagging oversold conditions, while the Moving Average Convergence Divergence (MACD) has just inched marginally above zero with a very shallow profile, hinting that bearish momentum is strong but not accelerating, in line with the elevated Average Directional Index near 50 that signals a mature downtrend.
On the topside, initial resistance lies at 0.8350, followed by 0.8400 and 0.8450. Beyond these levels, the 50-day SMA at 0.8489, the 100-day SMA at 0.8523 and the 200-day SMA at 0.8599 present further hurdles.
On the downside, immediate support aligns with the recent floor around 0.8330, with a deeper bearish extension eyeing the next horizontal level at 0.8300 if selling pressure resumes.
(The technical analysis of this story was written with the help of an AI tool. Know more.)
Pound Sterling Price Today
The table below shows the percentage change of British Pound (GBP) against listed major currencies today. British Pound was the strongest against the New Zealand Dollar.
| USD | EUR | GBP | JPY | CAD | AUD | NZD | CHF | |
|---|---|---|---|---|---|---|---|---|
| USD | 0.40% | 0.36% | 0.33% | 0.30% | 0.77% | 0.84% | 0.13% | |
| EUR | -0.40% | -0.04% | -0.07% | -0.08% | 0.38% | 0.44% | -0.26% | |
| GBP | -0.36% | 0.04% | -0.02% | -0.05% | 0.42% | 0.47% | -0.23% | |
| JPY | -0.33% | 0.07% | 0.02% | -0.01% | 0.44% | 0.51% | -0.19% | |
| CAD | -0.30% | 0.08% | 0.05% | 0.00% | 0.46% | 0.52% | -0.18% | |
| AUD | -0.77% | -0.38% | -0.42% | -0.44% | -0.46% | 0.06% | -0.64% | |
| NZD | -0.84% | -0.44% | -0.47% | -0.51% | -0.52% | -0.06% | -0.69% | |
| CHF | -0.13% | 0.26% | 0.23% | 0.19% | 0.18% | 0.64% | 0.69% |
The heat map shows percentage changes of major currencies against each other. The base currency is picked from the left column, while the quote currency is picked from the top row. For example, if you pick the British Pound from the left column and move along the horizontal line to the US Dollar, the percentage change displayed in the box will represent GBP (base)/USD (quote).
추천 기사


