


EUR/USD Price Forecast: Buyers remain in charge above the 200-day SMA
- EUR/USD holds above key daily moving averages, keeping the technical outlook constructive.
- Momentum cools slightly as RSI slips to the mid-60s and the MACD histogram fades.
- The 200-day SMA at 1.1633 provides immediate support below current levels.
EUR/USD is virtually unchanged on Thursday, with price action settling into consolidation after the pair climbed to a three-month high of 1.1711 earlier this week. The near-term fundamental and technical backdrop continues to favour the Euro, although momentum indicators are showing early signs of cooling as the pair attempts to build a base just above the 200-day Simple Moving Average (SMA).
At the time of writing, EUR/USD trades around 1.1651. Federal Reserve (Fed) Chair Kevin Warsh’s speech at the Jackson Hole Symposium on Friday is the key risk event and could determine the US Dollar’s next move and, in turn, the direction of EUR/USD.
ECB tightening expectations underpin EUR
Strategists at Brown Brothers Harriman note that “EUR/USD is directionless around 1.1650, with the 200-day moving average at 1.1632 offering key support,” highlighting a market that is consolidating rather than trending. They point out that “the swaps curve has virtually fully priced in a 25bps ECB rate hike to 2.50% at the next September 10 meeting and a total of 60bps of tightening over the next twelve months,” a policy path they describe as “reasonable and supportive of EUR.” In their view, the backdrop of “Eurozone inflation is above target, and leading indicators point to stronger economic activity” reinforces the case for further ECB tightening and underpins the single currency at current levels.
Technical analysis
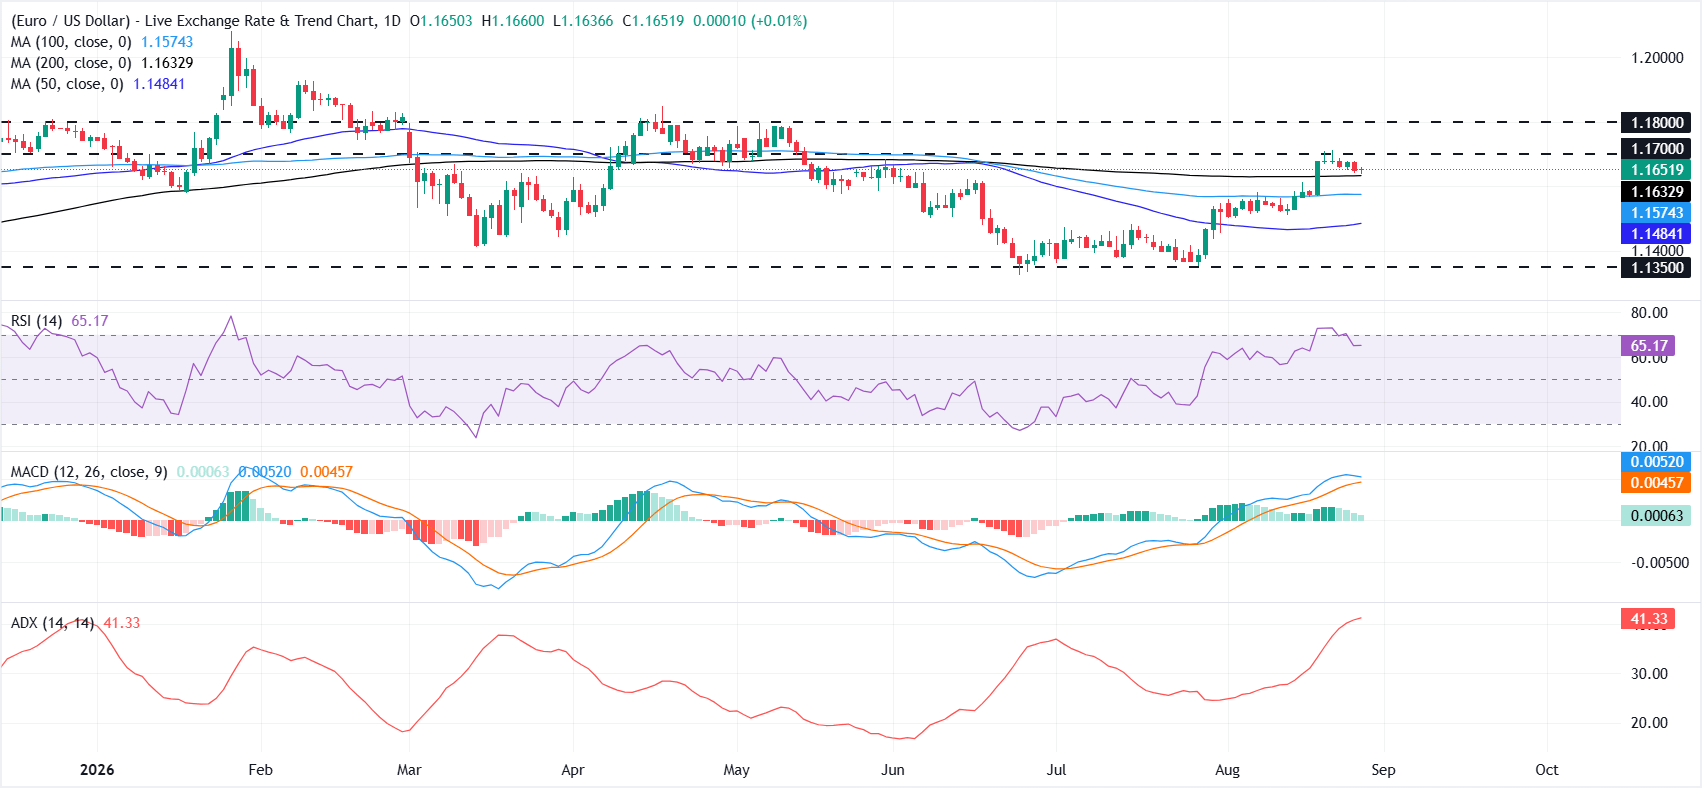
From a technical perspective, EUR/USD has maintained a steady uptrend since the start of the month, forming a sequence of higher highs and higher lows while reclaiming the key 50-day, 100-day and 200-day Simple Moving Averages (SMAs), which are clustered between roughly 1.1480 and 1.1630.
Momentum indicators remain supportive, although upside strength is showing some signs of cooling. The Relative Strength Index (RSI) has eased to around 65 after briefly entering overbought territory, while the Moving Average Convergence Divergence (MACD) remains in positive territory even as the green histogram fades. At the same time, the Average Directional Index (ADX) above 40 points to a strong underlying trend rather than a corrective bounce.
On the upside, immediate resistance is seen at the 1.1700 psychological mark, followed by the 1.1800 level. On the downside, the 200-day SMA around 1.1633 offers initial support, followed by the 100-day SMA near 1.1574 and the 50-day SMA around 1.1484. A deeper pullback could expose the 1.1350 area.
(The technical analysis of this story was written with the help of an AI tool. Know more.)
ECB FAQs
The European Central Bank (ECB) in Frankfurt, Germany, is the reserve bank for the Eurozone. The ECB sets interest rates and manages monetary policy for the region. The ECB primary mandate is to maintain price stability, which means keeping inflation at around 2%. Its primary tool for achieving this is by raising or lowering interest rates. Relatively high interest rates will usually result in a stronger Euro and vice versa. The ECB Governing Council makes monetary policy decisions at meetings held eight times a year. Decisions are made by heads of the Eurozone national banks and six permanent members, including the President of the ECB, Christine Lagarde.
In extreme situations, the European Central Bank can enact a policy tool called Quantitative Easing. QE is the process by which the ECB prints Euros and uses them to buy assets – usually government or corporate bonds – from banks and other financial institutions. QE usually results in a weaker Euro. QE is a last resort when simply lowering interest rates is unlikely to achieve the objective of price stability. The ECB used it during the Great Financial Crisis in 2009-11, in 2015 when inflation remained stubbornly low, as well as during the covid pandemic.
Quantitative tightening (QT) is the reverse of QE. It is undertaken after QE when an economic recovery is underway and inflation starts rising. Whilst in QE the European Central Bank (ECB) purchases government and corporate bonds from financial institutions to provide them with liquidity, in QT the ECB stops buying more bonds, and stops reinvesting the principal maturing on the bonds it already holds. It is usually positive (or bullish) for the Euro.
추천 기사


