


Silver Price Forecast: Buyers struggle below the 100-day SMA
- Silver retreats as the US Dollar recovers after the latest US inflation figures.
- Headline PCE comes in slightly above forecasts, while core inflation meets expectations.
- XAG/USD holds above the 50-day SMA, but resistance from the 100-day SMA remains a key hurdle.
Silver (XAG/USD) comes under selling pressure on Wednesday as the US Dollar (USD) strengthens following the latest United States (US) inflation data. At the time of writing, XAG/USD trades around $67.79, down nearly 1.26% on the day.
The headline Personal Consumption Expenditures (PCE) Price Index rose 0.2% MoM in July, above the 0.1% forecast, while the annual rate held steady at 3.7%, exceeding expectations of 3.6%. Meanwhile, core PCE inflation increased 0.2% MoM and 3.3% YoY, matching market expectations.
The upside surprise in headline inflation gives the US Dollar a modest lift after its recent weakness. The US Dollar Index (DXY), which tracks the US currency against a basket of six major currencies, trades around 99.20, up nearly 0.30% on the day.
Even so, the data did little to change expectations for the Federal Reserve’s (Fed) September meeting as traders focused on the in-line core readings. According to the CME FedWatch Tool, markets see a roughly 65% chance that the central bank will leave interest rates unchanged next month. This could prevent a deeper decline, although repeated rejection near $70.00 and the struggle to hold above the 100-day Simple Moving Average (SMA) keep the upside limited.
Technical Analysis
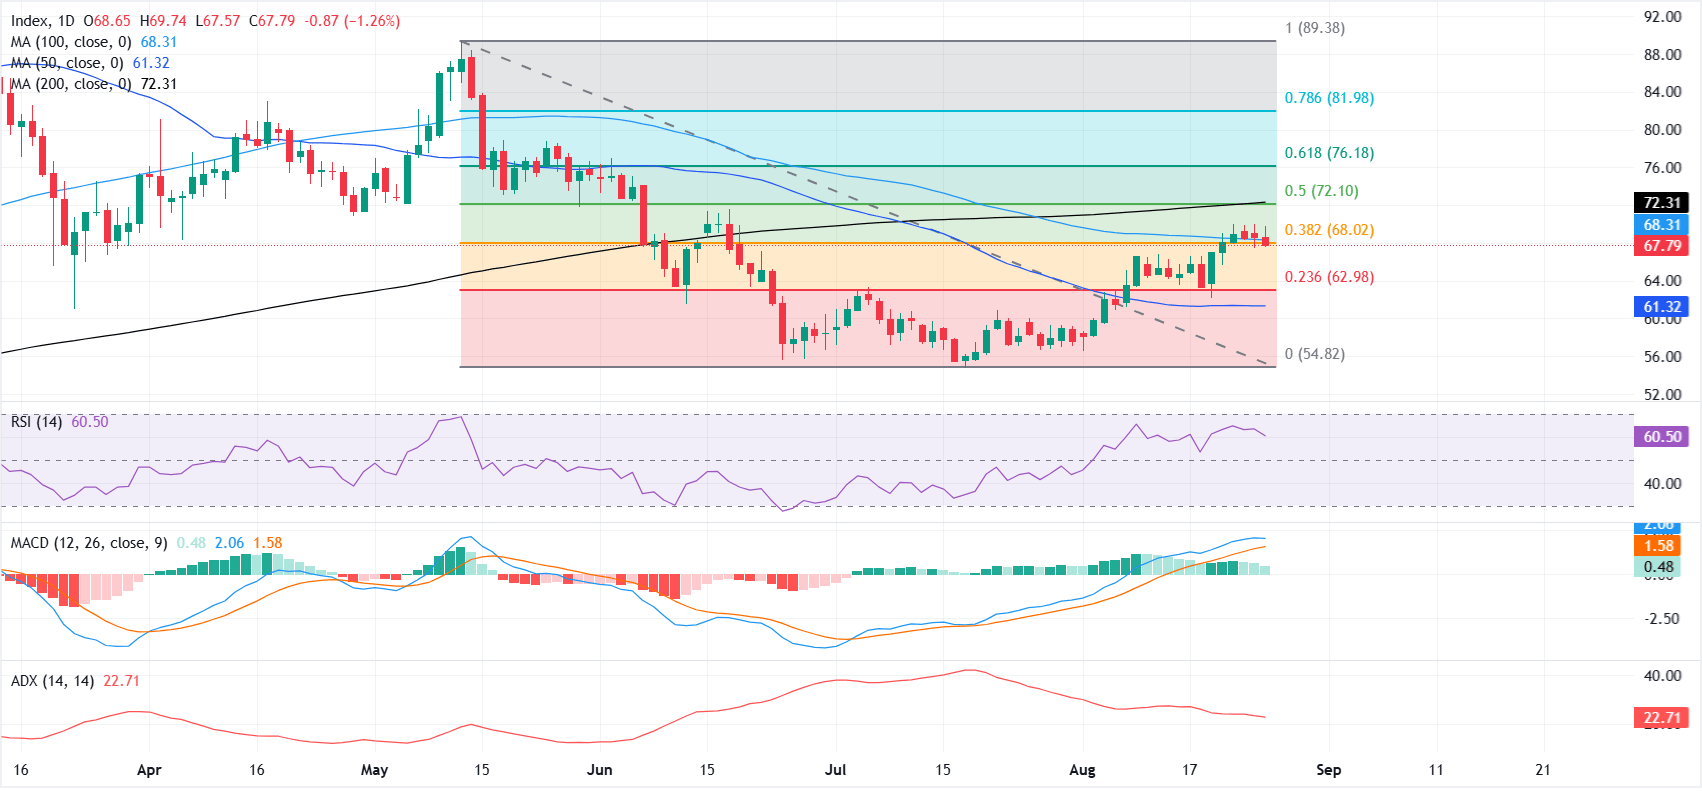
On the daily chart, XAG/USD holds above the 50-day SMA but remains capped by the 100-day and 200-day SMAs. This configuration suggests a neutral-to-bullish near-term bias, with price attempting to build a base above short-term trend support while facing a dense band of overhead supply.
The Relative Strength Index (RSI) stands at 60, showing positive momentum without entering overbought territory. The Moving Average Convergence Divergence (MACD) indicator also stays above zero, although buyers have yet to build enough momentum to break the nearby moving-average barriers.
On the upside, immediate resistance emerges at the 38.2% Fibonacci retracement of the broader downswing at $68.02, closely followed by the 100-day SMA at $68.31, forming a tight cap just above spot. Further up, the 50.0% retracement at $72.10 aligns with the 200-day SMA at $72.31, reinforcing a more significant hurdle before $76.18 (61.8% retracement) and $81.98 (78.6% retracement) come into view.
On the downside, initial support is seen at the 23.6% Fibonacci retracement near $62.98, ahead of the 50-day SMA at $61.32; a deeper slide would expose the structural low around $54.82, where the current Fibonacci sequence anchors the move.
(The technical analysis of this story was written with the help of an AI tool. Know more.)
Silver FAQs
Silver is a precious metal highly traded among investors. It has been historically used as a store of value and a medium of exchange. Although less popular than Gold, traders may turn to Silver to diversify their investment portfolio, for its intrinsic value or as a potential hedge during high-inflation periods. Investors can buy physical Silver, in coins or in bars, or trade it through vehicles such as Exchange Traded Funds, which track its price on international markets.
Silver prices can move due to a wide range of factors. Geopolitical instability or fears of a deep recession can make Silver price escalate due to its safe-haven status, although to a lesser extent than Gold's. As a yieldless asset, Silver tends to rise with lower interest rates. Its moves also depend on how the US Dollar (USD) behaves as the asset is priced in dollars (XAG/USD). A strong Dollar tends to keep the price of Silver at bay, whereas a weaker Dollar is likely to propel prices up. Other factors such as investment demand, mining supply – Silver is much more abundant than Gold – and recycling rates can also affect prices.
Silver is widely used in industry, particularly in sectors such as electronics or solar energy, as it has one of the highest electric conductivity of all metals – more than Copper and Gold. A surge in demand can increase prices, while a decline tends to lower them. Dynamics in the US, Chinese and Indian economies can also contribute to price swings: for the US and particularly China, their big industrial sectors use Silver in various processes; in India, consumers’ demand for the precious metal for jewellery also plays a key role in setting prices.
Silver prices tend to follow Gold's moves. When Gold prices rise, Silver typically follows suit, as their status as safe-haven assets is similar. The Gold/Silver ratio, which shows the number of ounces of Silver needed to equal the value of one ounce of Gold, may help to determine the relative valuation between both metals. Some investors may consider a high ratio as an indicator that Silver is undervalued, or Gold is overvalued. On the contrary, a low ratio might suggest that Gold is undervalued relative to Silver.
추천 기사


