


EUR/GBP Price Forecast: Neutral RSI signals further consolidation
- EUR/GBP remains range-bound below a cluster of key daily moving averages.
- The flat MACD histogram and neutral RSI point to subdued buying pressure.
- The 50-day Simple Moving Average at 0.8566 acts as a near-term pivot for the cross.
EUR/GBP remains stuck in a narrow trading range this month, stalling the rebound from near 0.8460 in mid-July as buyers struggle to clear the 50-day Simple Moving Average (SMA). At the time of writing, the cross trades around 0.8567 during European trading hours on Friday, virtually unchanged on the day.
Traders show a muted reaction to Friday’s economic data. UK Retail Sales came in weaker than expected, while the previous month’s reading was revised lower. Meanwhile, preliminary August Purchasing Managers Index (PMI) data from both the UK and the Eurozone exceeded market forecasts.
Technical Analysis
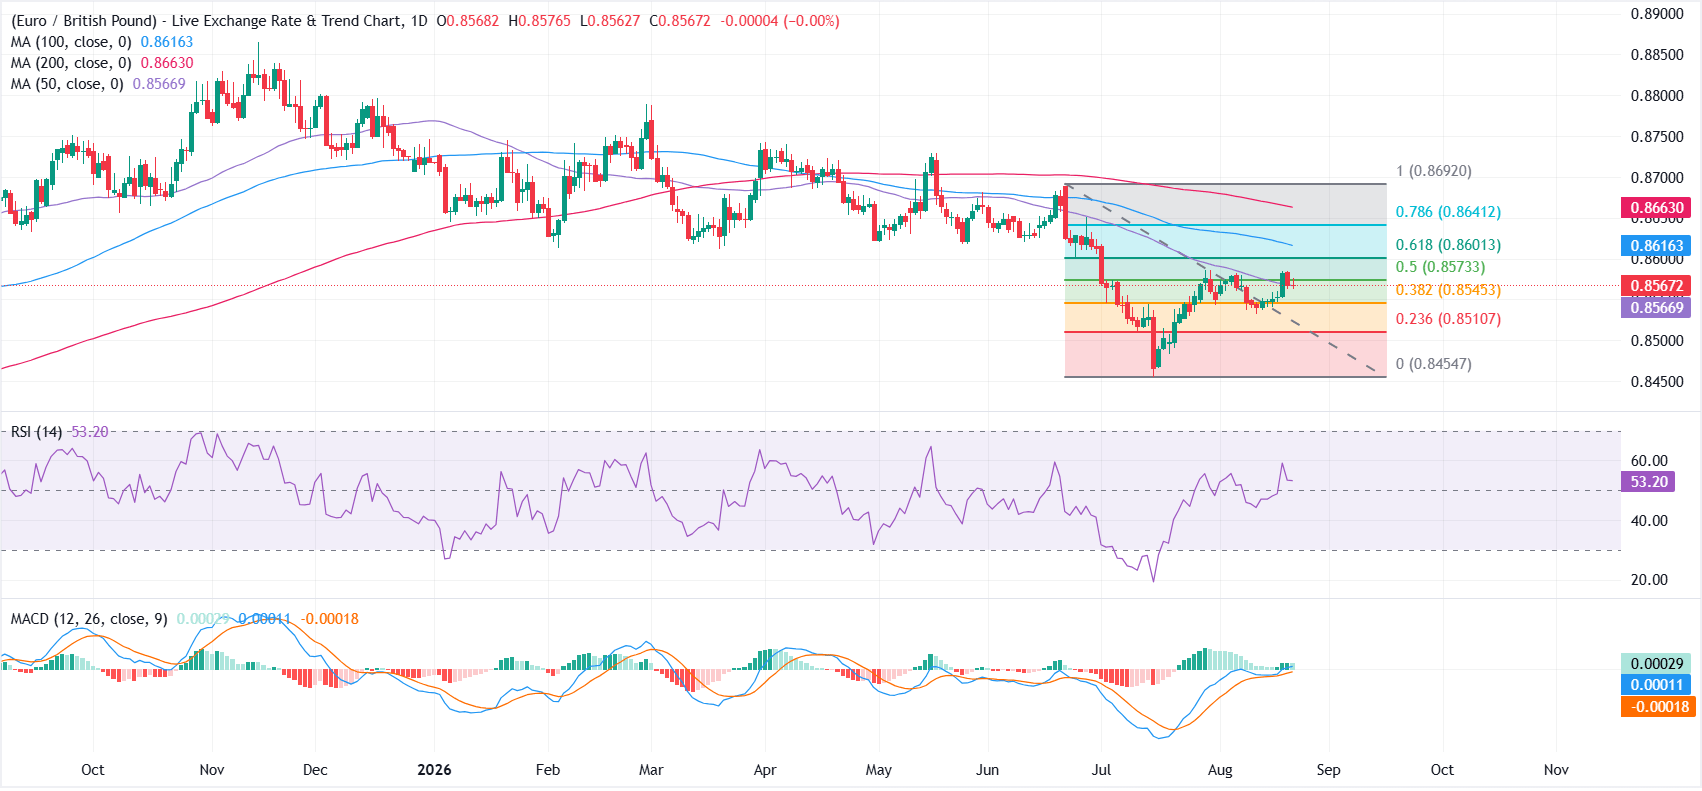
On the daily chart, EUR/GBP is capped beneath a dense band of medium- and long-term moving averages and Fibonacci levels, which keeps the near-term bias mildly bearish despite some stabilization in momentum.
Price is sitting on the 50-day Simple Moving Average (SMA) around 0.8567. The Relative Strength Index (RSI) at around 53 is neutral, and the Moving Average Convergence Divergence (MACD) lines are slightly above zero with a flat histogram, suggesting subdued upside pressure rather than a decisive trend reversal.
On the topside, immediate resistance emerges at the 50.0% Fibonacci retracement at 0.8573, with the 61.8% retracement at 0.8601 and the 100-day SMA at 0.8616 forming a nearby cluster that could stall any recovery.
Further up, the 78.6% Fibonacci level at 0.8641 precedes the 200-day SMA at 0.8663, while the June high and 100.0% retracement at 0.8692 marks a stronger barrier. On the downside, initial support is seen at the 38.2% Fibonacci retracement at 0.8545, ahead of the 23.6% level at 0.8511, with the anchor low around 0.8455 acting as a more significant floor if selling pressure resumes.
(The technical analysis of this story was written with the help of an AI tool. Know more.)
Euro Price Today
The table below shows the percentage change of Euro (EUR) against listed major currencies today. Euro was the strongest against the US Dollar.
| USD | EUR | GBP | JPY | CAD | AUD | NZD | CHF | |
|---|---|---|---|---|---|---|---|---|
| USD | -0.18% | -0.19% | -0.24% | -0.38% | -0.72% | -0.66% | -0.13% | |
| EUR | 0.18% | -0.01% | -0.07% | -0.22% | -0.54% | -0.46% | 0.05% | |
| GBP | 0.19% | 0.00% | -0.07% | -0.21% | -0.52% | -0.45% | 0.06% | |
| JPY | 0.24% | 0.07% | 0.07% | -0.13% | -0.48% | -0.44% | 0.11% | |
| CAD | 0.38% | 0.22% | 0.21% | 0.13% | -0.34% | -0.28% | 0.24% | |
| AUD | 0.72% | 0.54% | 0.52% | 0.48% | 0.34% | 0.04% | 0.58% | |
| NZD | 0.66% | 0.46% | 0.45% | 0.44% | 0.28% | -0.04% | 0.55% | |
| CHF | 0.13% | -0.05% | -0.06% | -0.11% | -0.24% | -0.58% | -0.55% |
The heat map shows percentage changes of major currencies against each other. The base currency is picked from the left column, while the quote currency is picked from the top row. For example, if you pick the Euro from the left column and move along the horizontal line to the US Dollar, the percentage change displayed in the box will represent EUR (base)/USD (quote).
추천 기사


