


USD/MXN Price Forecast: Bears eye 17.00 as downtrend stretches
- USD/MXN extends 14-day slide, hovering just above 17.00.
- Break below 17.00 exposes 16.52 and 16.26 supports.
- Recovery above 17.40 could target 17.50 and 200-day SMA.
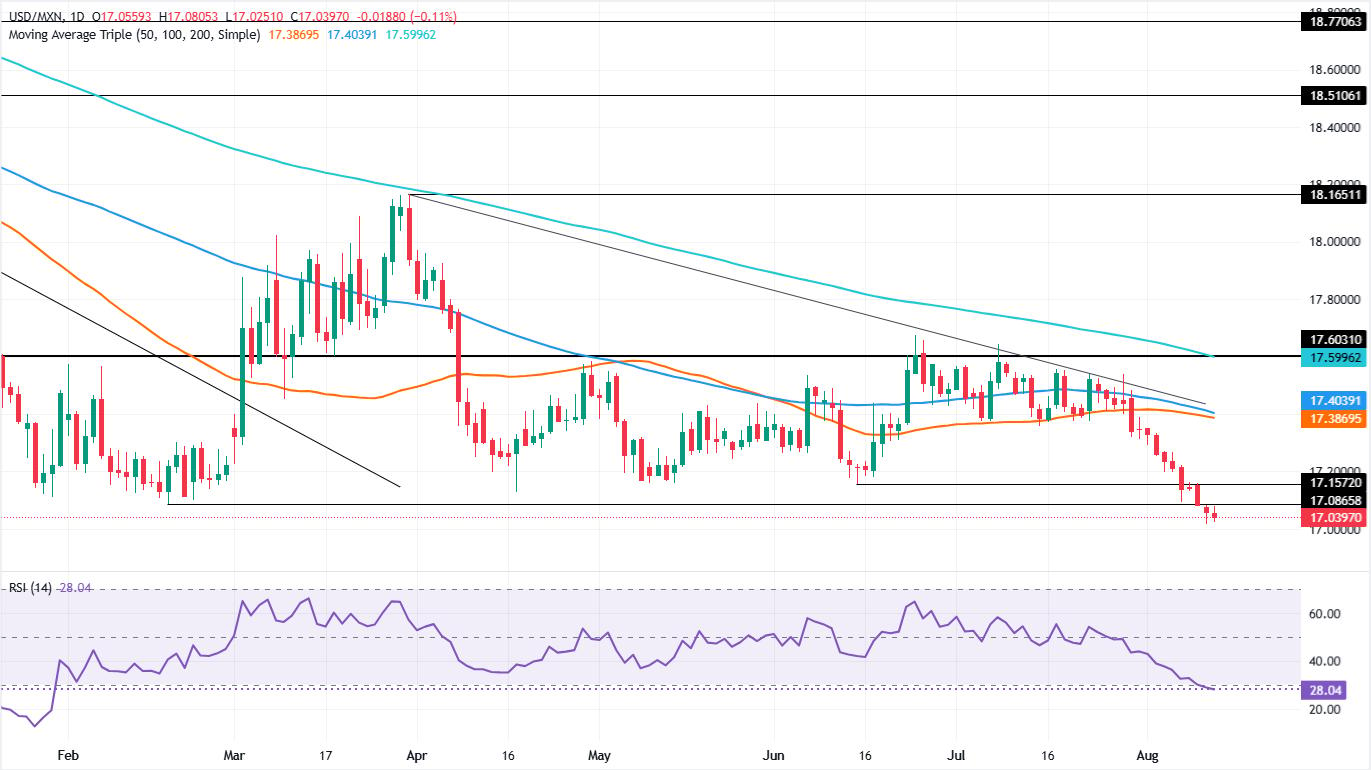
The USD/MXN extends its downtrend for the 14th straight day, down a minimal 0.08% as the Mexican Peso hovers near a 24-month low of 17.01 on Thursday. At the time of writing, the emerging-market currency pair trades below 17.05 as traders digest recent soft US inflation figures on the consumer and producer sides.
USD/MXN Price Forecast: Technical Outlook
After clearing the 50- and 100-day Simple Moving Averages (SMAs) by the end of July, the USD/MXN accelerated its downtrend to yearly lows. Worth noting that the market structure of lower-highs and lower-lows is respected, and a breach below the 17.00 figure could open the door for further downside.
The Relative Strength Index (RSI) suggests the downtrend could be losing steam. Although USD/MXN drifts lower, the rate of change between sessions has narrowed, meaning that market participants remain reluctant to open fresh directional bets.
This could mean two things: first, that some consolidation lies ahead before the downtrend resumes to challenge the lower levels hit in 2024; or that USD/MXN could’ve found its floor and reversed course, aiming higher.
For the first scenario, if the USD/MXN clears below 17.00, this opens the path to challenge May’s 2024 monthly low of 16.52, followed by April’s 2024 low of the month at 16.26. Once those two levels are removed, the next support is at 16.00.
Conversely, if USD/MXN rises above the 50-day SMA at 17.38, followed by the 100-day SMA at 17.40, it could exacerbate a rally towards 17.50. On further strength, the next resistance is the 200-day SMA at 17.59.
USD/MXN Price Chart – Daily
Mexican Peso FAQs
The Mexican Peso (MXN) is the most traded currency among its Latin American peers. Its value is broadly determined by the performance of the Mexican economy, the country’s central bank’s policy, the amount of foreign investment in the country and even the levels of remittances sent by Mexicans who live abroad, particularly in the United States. Geopolitical trends can also move MXN: for example, the process of nearshoring – or the decision by some firms to relocate manufacturing capacity and supply chains closer to their home countries – is also seen as a catalyst for the Mexican currency as the country is considered a key manufacturing hub in the American continent. Another catalyst for MXN is Oil prices as Mexico is a key exporter of the commodity.
The main objective of Mexico’s central bank, also known as Banxico, is to maintain inflation at low and stable levels (at or close to its target of 3%, the midpoint in a tolerance band of between 2% and 4%). To this end, the bank sets an appropriate level of interest rates. When inflation is too high, Banxico will attempt to tame it by raising interest rates, making it more expensive for households and businesses to borrow money, thus cooling demand and the overall economy. Higher interest rates are generally positive for the Mexican Peso (MXN) as they lead to higher yields, making the country a more attractive place for investors. On the contrary, lower interest rates tend to weaken MXN.
Macroeconomic data releases are key to assess the state of the economy and can have an impact on the Mexican Peso (MXN) valuation. A strong Mexican economy, based on high economic growth, low unemployment and high confidence is good for MXN. Not only does it attract more foreign investment but it may encourage the Bank of Mexico (Banxico) to increase interest rates, particularly if this strength comes together with elevated inflation. However, if economic data is weak, MXN is likely to depreciate.
As an emerging-market currency, the Mexican Peso (MXN) tends to strive during risk-on periods, or when investors perceive that broader market risks are low and thus are eager to engage with investments that carry a higher risk. Conversely, MXN tends to weaken at times of market turbulence or economic uncertainty as investors tend to sell higher-risk assets and flee to the more-stable safe havens.
추천 기사


