


NZD/USD Price Forecast: Resistance at 0.5880 keeps holding bulls
- NZD/USD fails to extend gains beyond 0.5880 despite a moderate risk appetite.
- Hopes that the RBNZ will stand pat on Wednesday are weighing on NZD bulls.
- Technically, an ascending triangle pattern hints at a deeper recovery.
The New Zealand Dollar (NZD) maintains a moderately negative tone against the US Dollar (USD) on Monday, despite a somewhat brighter market sentiment. The Kiwi Dollar is failing to draw any significant support from market hopes of a peace deal in Iran and remains trading within previous ranges, with upside attempts capped below the 0.5880 area and six-week lows at 0.5815 still in sight.
US President Donald Trump and US Secretary of State Marco Rubio have boosted expectations of a negotiated end to Iran’s war, which is weighing moderately on the safe-haven U.S. Dollar. The NZD, however, is struggling to appreciate further, with investors betting on steady interest rates after the Reserve Bank of New Zealand’s (RBNZ) monetary policy meeting, due on Wednesday.
Inflation pressures remain high in New Zealand amid a sharp increase in energy costs, pressuring the central bank to tighten monetary policy further. Policymakers, however, are expected to take into account that Gross Domestic Product (GDP) is growing at a meagre 0.2% and will refrain from tightening borrowing costs further, wary of tipping the economy into recession.
Technical Analysis: Trading within an ascending triangle pattern
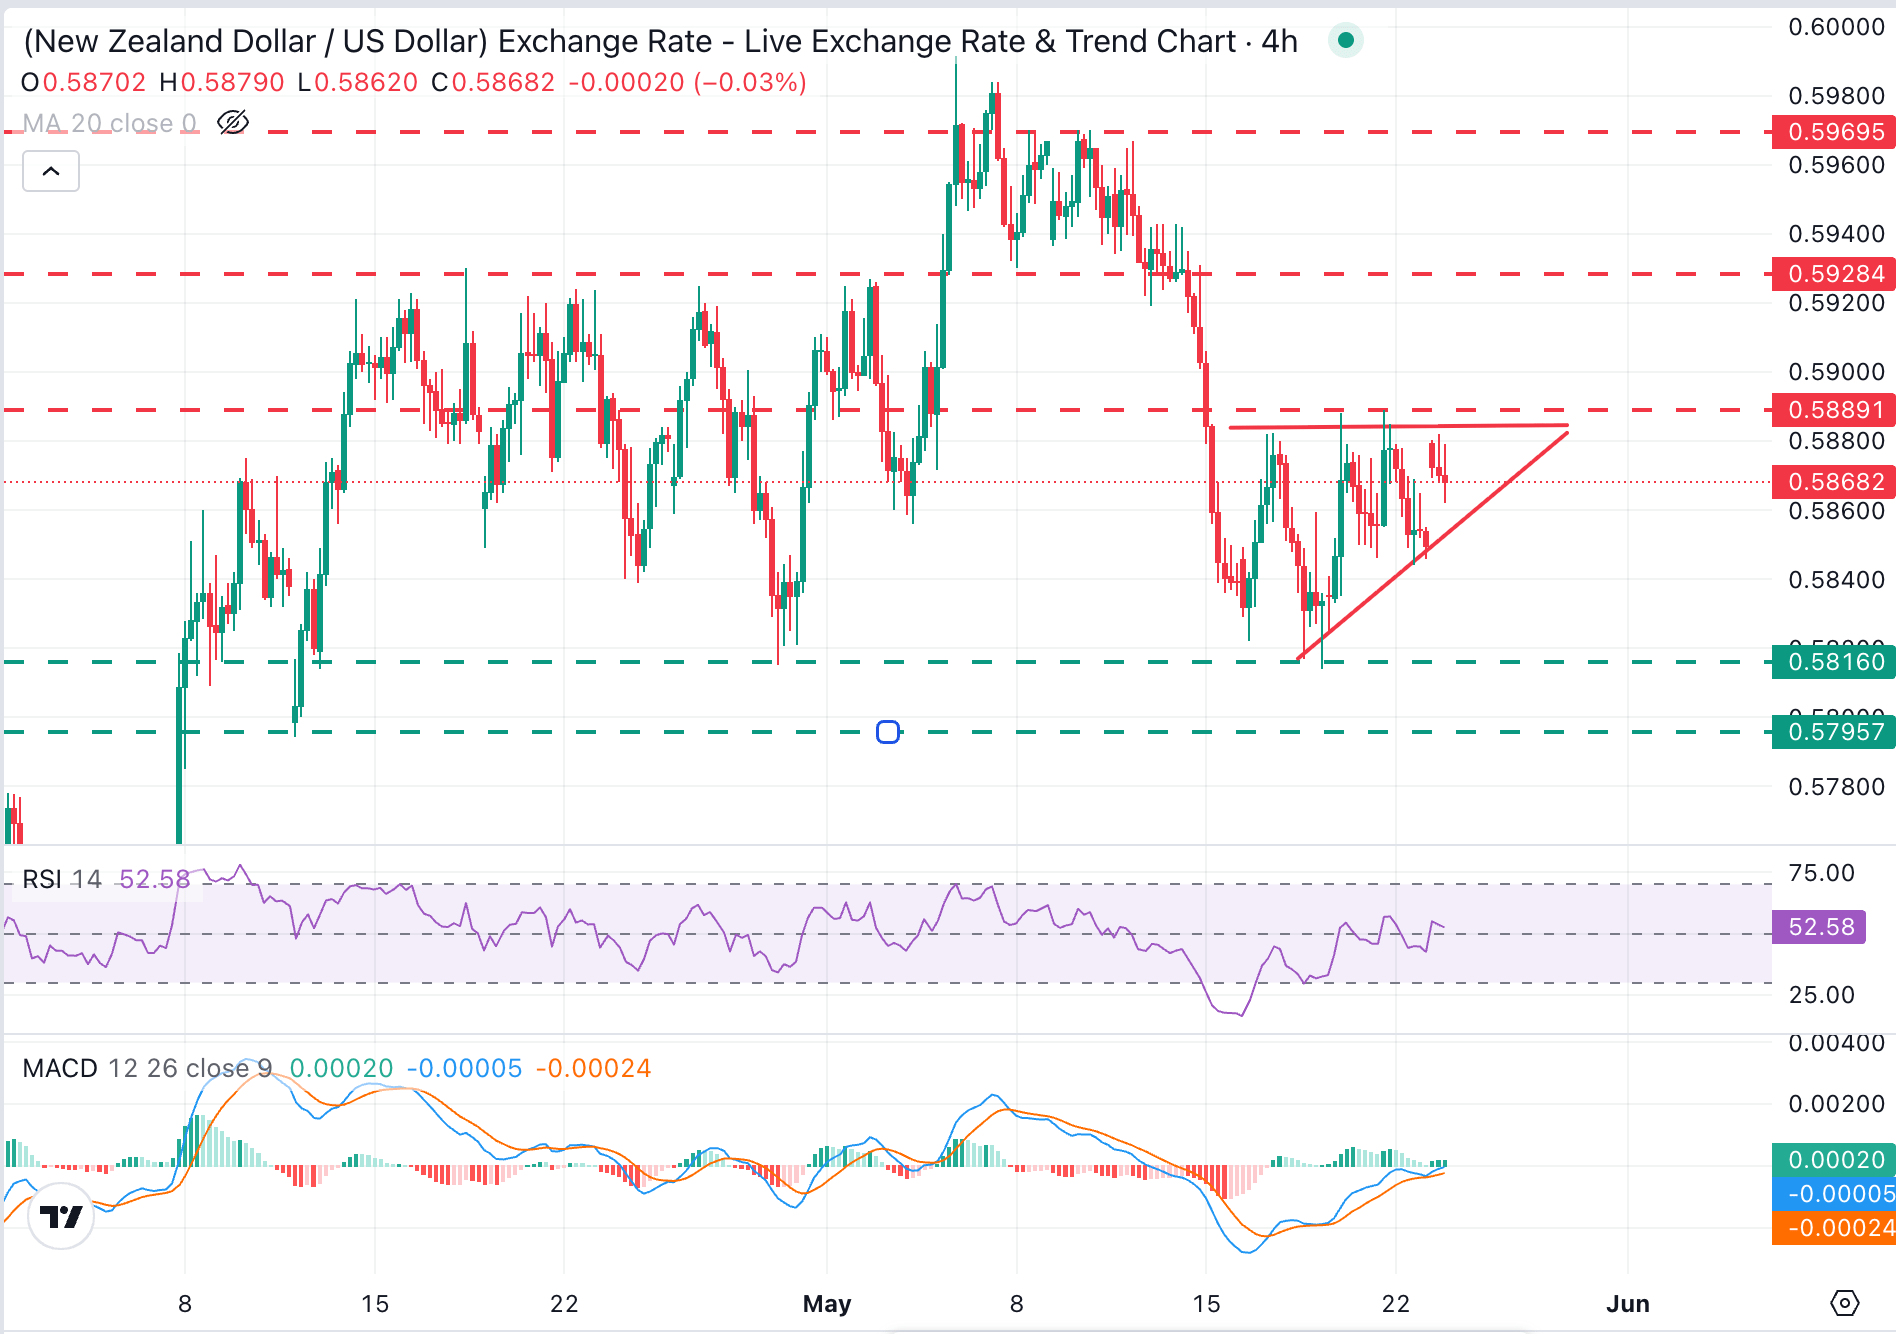
The NZD/USD is holding a neutral-to-slightly bullish tone with price action showing an ascending triangle, a pattern often anticipating bullish outcomes. The 4-hour Relative Strength Index (RSI) hovers in the low 50s, hinting at stabilising momentum, while the Moving Average Convergence Divergence (MACD) remains marginally positive, altogether suggesting a modest bullish bias.
Bulls are facing strong resistance in the 0.5880-0.5890 area, which capped upside attempts several times last week. A sustained break above this cluster would expose a previous support area between 0.5920 and 0.5930 before the May 8, 11, and 12 highs in the 0.5970 area.
On the downside, immediate support is seen at the base of the triangle, at 0.5860, which so far guards the path to the mentioned 0.5815 floor (April 29, May 19 lows) and the April 13 low, at 0.5794.
(The technical analysis of this story was written with the help of an AI tool.)
New Zealand Dollar Price Today
The table below shows the percentage change of New Zealand Dollar (NZD) against listed major currencies today. New Zealand Dollar was the strongest against the Canadian Dollar.
| USD | EUR | GBP | JPY | CAD | AUD | NZD | CHF | |
|---|---|---|---|---|---|---|---|---|
| USD | -0.28% | -0.36% | -0.14% | -0.02% | -0.44% | -0.31% | -0.33% | |
| EUR | 0.28% | -0.09% | 0.13% | 0.25% | -0.17% | -0.04% | -0.07% | |
| GBP | 0.36% | 0.09% | 0.21% | 0.34% | -0.10% | 0.06% | 0.01% | |
| JPY | 0.14% | -0.13% | -0.21% | 0.13% | -0.33% | -0.21% | -0.24% | |
| CAD | 0.02% | -0.25% | -0.34% | -0.13% | -0.44% | -0.31% | -0.35% | |
| AUD | 0.44% | 0.17% | 0.10% | 0.33% | 0.44% | 0.13% | 0.10% | |
| NZD | 0.31% | 0.04% | -0.06% | 0.21% | 0.31% | -0.13% | -0.04% | |
| CHF | 0.33% | 0.07% | -0.01% | 0.24% | 0.35% | -0.10% | 0.04% |
The heat map shows percentage changes of major currencies against each other. The base currency is picked from the left column, while the quote currency is picked from the top row. For example, if you pick the New Zealand Dollar from the left column and move along the horizontal line to the US Dollar, the percentage change displayed in the box will represent NZD (base)/USD (quote).
추천 기사


