


If a Recession Is Coming in 2027, I'm Making This 1 Investing Move Without Any Hesitation
Key Points
Most investors and analysts don’t expect a recession to occur in 2027.
But if it happens, I’d be ready to buy more stocks.
- Motley Fool Issues Rare "Total Conviction" Buy Alert ›
There's a 28% chance the U.S. could experience its next recession by the end of 2027, according to the latest predictions on Polymarket. U.S. Bank's Economic Research Group has also set a 25% chance of a recession occurring within the next 12 months.
Those predictions might seem bullish, but they also suggest that persistent inflation, additional rate hikes, and other macro headwinds could still hurt the U.S. economy and trigger the next recession. If that happens, I'd stick with one simple strategy: buy rather than sell.
Missed AI’s "Act 1"? Act 2 Could Be 15x Bigger. Most investors think they missed the AI boat because they didn't buy Nvidia in 2005. But according to our analysts, we’re only at the end of "Act 1"—the R&D phase. "Act 2" is the global rollout. Continue »
Image source: Getty Images
Why should investors buy stocks during a recession?
The S&P 500 (SNPINDEX: ^GSPC) has generated an average annual total return of nearly 11% since its inception in 1957. A $1,000 investment in the S&P 500, with reinvested dividends, would be worth $1.16 million today. That's about $97,315 in 1957 dollars.
But to achieve that gain, you would have needed to stay invested in the S&P 500 through ten official recessions and 11 bear markets. That's easier said than done, since the S&P 500 experienced steep peak-to-trough downturns during those bear markets. That includes declines of 49% in 2000-2022, 57% in 2007-2009, 34% in 2020, and 25% in 2022.
At the nadir of each of those declines, many investors sold their stocks. But here's how much the S&P 500 grew -- with reinvested dividends -- from those multi-year bottoms.
|
Metric |
Oct. 9, 2002 |
March 9, 2009 |
March 23, 2020 |
Oct. 12, 2022 |
|---|---|---|---|---|
|
S&P 500 Total Return Since... |
1,391% |
1,410% |
263% |
119% |
|
Growth of a $1,000 Investment |
$14,911 |
$15,095 |
$3,630 |
$2,190 |
Data source: YCharts
In each case, investors who bought more stocks as the market crashed fared better than those who retreated. That's why Warren Buffett famously said: "We simply attempt to be fearful when others are greedy and to be greedy only when others are fearful."
Even if you had done nothing, you would still have fared better than investors who fled the market. A $1,000 investment in the S&P 500 on the first trading day of 2002 -- without any additional investments except for reinvested dividends -- would still be worth about $10,580.
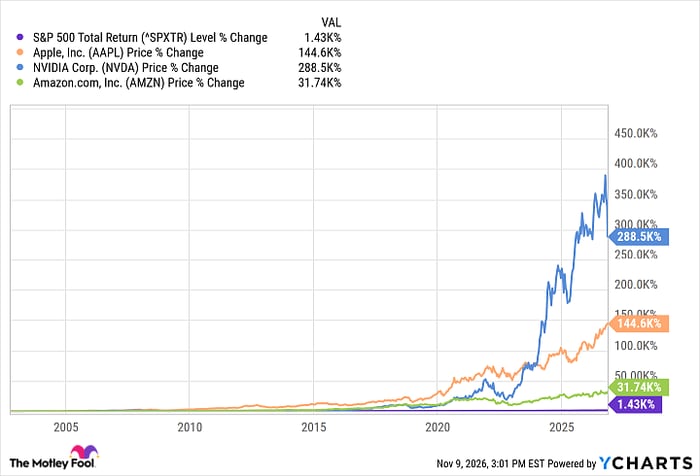
Sticking with some top-performing individual stocks would have given you even bigger gains. Here's how much Apple, Nvidia, and Microsoft outperformed the S&P 500 since its darkest day in Oct. 2002.
Source: YCharts
Past performance never guarantees future gains, but prematurely selling those tech giants -- which now collectively account for over a fifth of the S&P 500 -- was clearly a bad move for long-term investors.
How do you know if the market has bottomed out?
It's impossible to perfectly time the market. But as someone who started investing during the Great Recession, I can tell you to watch a few key indicators.
If the S&P 500's forward price-to-earnings ratio -- which is currently at 18 -- drops to the mid-teens, it indicates the market is due for a rebound. That multiple dropped to 14 in 2002, 10 in 2009, 13 in 2020, and 16 in 2022. CNN's Fear and Greed Index -- which bounces between "extreme fear" and "extreme greed" -- is another popular way to gauge the market's overall sentiment.
Since you'll never know when the next bear market will bottom out, it's smarter to simply nibble on more stocks in fixed dollar amounts as the broader market pulls back. By utilizing that dollar-cost averaging strategy, you'll buy more shares of a stock when its price is low, fewer shares when its price is high, and smooth out your average purchase price.
Should you buy stock in S&P 500 Index right now?
Before you buy stock in S&P 500 Index, consider this:
The Motley Fool Stock Advisor analyst team just identified what they believe are the 10 best stocks for investors to buy now… and S&P 500 Index wasn’t one of them. The 10 stocks that made the cut could produce monster returns in the coming years.
Consider when Netflix made this list on December 17, 2004... if you invested $1,000 at the time of our recommendation, you’d have $341,966!* Or when Nvidia made this list on April 15, 2005... if you invested $1,000 at the time of our recommendation, you’d have $1,146,819!*
Now, it’s worth noting Stock Advisor’s total average return is 852% — a market-crushing outperformance compared to 203% for the S&P 500. Don't miss the latest top 10 list, available with Stock Advisor, and join an investing community built by individual investors for individual investors.
See the 10 stocks »
*Stock Advisor returns as of November 9, 2026.
Leo Sun has positions in Apple. The Motley Fool has positions in and recommends Apple, Microsoft, Nvidia, and U.S. Bancorp. The Motley Fool has a disclosure policy.
Recommended Articles


