


Tesla Stock Price Forecast: Reclaiming $400, Shares Could Rise to $500
TradingKey - As of the close on Monday (November 2) Eastern Time, Tesla (TSLA) stock price rose again after three consecutive session pullbacks, closing at $403.82 that day, up 1%, hitting an intraday high of $414.23; in after-hours trading, the stock price rose slightly further to near $405. Over the past two weeks, Tesla's stock price has rebounded significantly from its low of $349.33 on October 16, regaining the $400 psychological level.
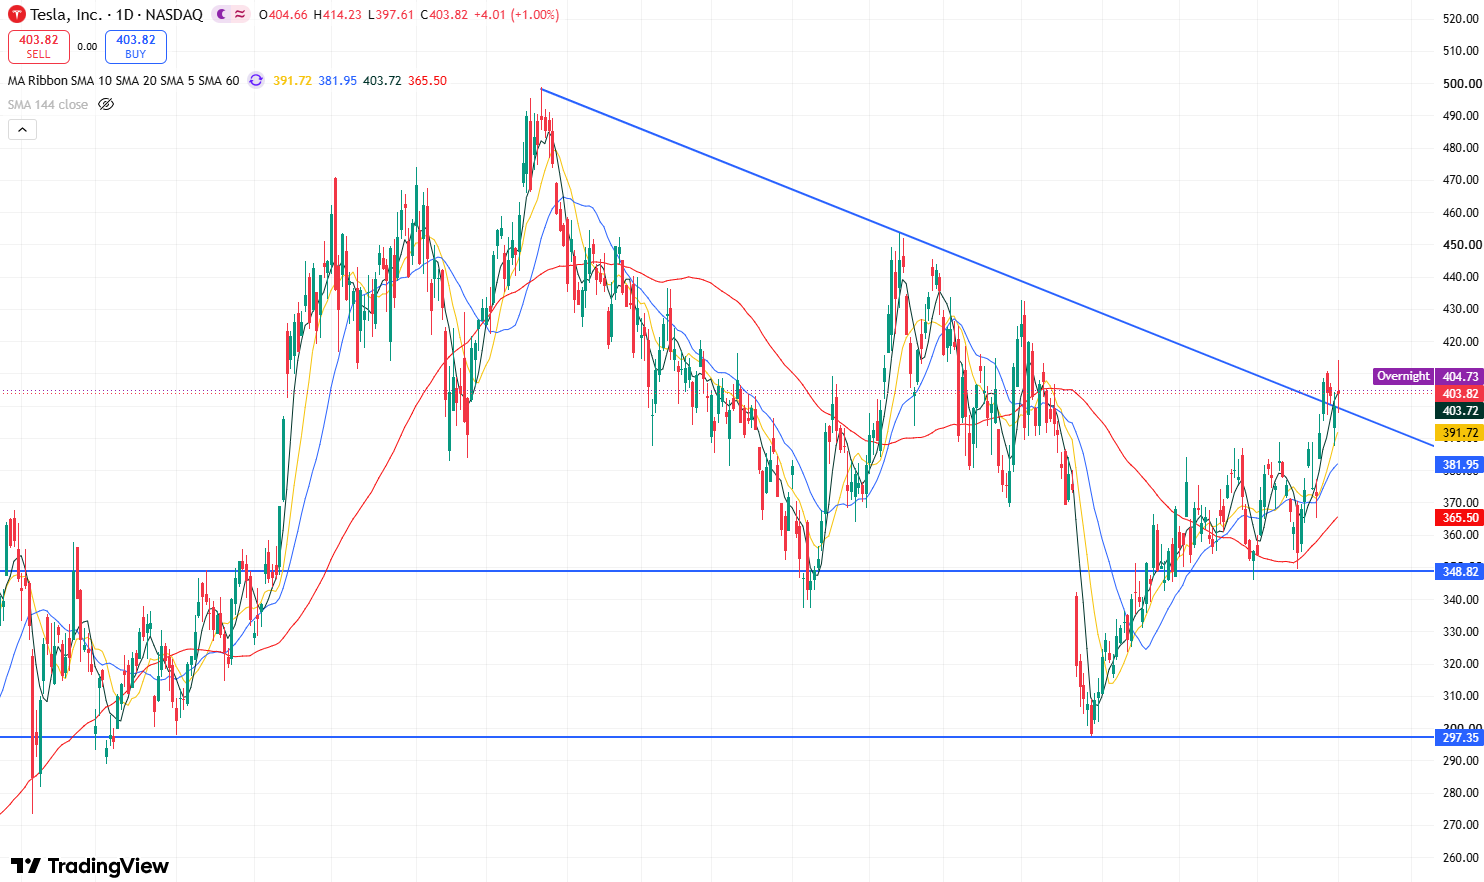
Tesla stock price daily chart, Source: TradingView
From the daily chart of Tesla's stock price, the downward trendline formed by connecting the previous candlestick highs has been effectively broken. This opens up upside room for the stock price and significantly strengthens market bullish momentum, suggesting the stock price may continue to rise in the short term.
In terms of technical indicators, the Relative Strength Index (RSI) stands around 62.5, still some distance from the overbought territory, indicating strong short-term upward momentum while not yet entering an extreme zone, which suggests further upside potential in the short term. Meanwhile, the MACD remains positive and in a bullish posture.
At present, as the stock price breaks through the downward trendline resistance and firmly re-establishes itself above $400, the upside room toward the $450 resistance level has opened up. If the stock can effectively break through and hold above $450, it may further challenge the $500 level.
On the downside, the primary support level to watch below is the $388–$390 range. If the price falls below $388, it may further test $380 down below, and further down, it could test the 60-day moving average (around $365). If the downward trend continues, it may test the key support level of $350.
Recommended Articles


