


BNB Price Forecast: BNB rebounds above $700 as Binance records net inflows after hack
- BNB gains above $700, building on short-term support provided by the 200-day EMA.
- Binance hourly deposits exceed withdrawals as the exchange recovers from last week’s $6.3 billion hack.
- BNB's technical outlook remains broadly bearish despite the subtle rebound, with momentum indicators still lagging.
BNB (BNB) springs up above $700 on Tuesday, as bulls push to regain momentum following last week’s sell-off. The decline from highs above $760 on Thursday to lows of $680 was largely driven by investor reaction to the security breach on Binance, the largest crypto exchange.
The hack impacted approximately $6.3 billion, the largest in crypto industry history. Binance, in collaboration with blockchain stakeholders, froze roughly $3 billion of the assets believed to have been siphoned by TraderTraitor, a hacker group linked to North Korea.
Binance reports net hourly inflows
Changpeng Zhao, Binance co-founder, popularly known as CZ, stated on X on Tuesday that Binance is experiencing net hourly inflows, with deposits exceeding withdrawals. The report follows the exchange's resumption of withdrawals on Sunday after it contained the security breach.
The exchange reported about $3.64 billion in initial net outflow volume, based on $4.65 billion in withdrawals and $1.01 billion in deposits. This figure represents roughly 2.1% of Binance’s $171 billion total assets under management, according to the Proof of Reserves (PoR) snapshot on Wednesday.
The sustained net hourly inflow volume could suggest that Binance has weathered the storm from the hack and is beginning to rebuild user trust. Binance announced it will cover the hack losses in full, using its internal insurance fund and assets to protect customers.
Meanwhile, retail interest in BNB has taken a back seat over the last few days, as reflected in perpetual futures Open Interest (OI) standing at $1.74 million BNB on Tuesday, down from 1.95 million BNB last Friday. Reduced retail risk-on sentiment could weigh on the token, limiting its recovery potential while raising the odds of an extended sell-off.
Technical analysis: BNB ticks up above key support
BNB trades at $700, holding just above the 200-day Exponential Moving Average (EMA) near $692, which provides immediate trend support, but the token remains capped by the 100-day and 50-day EMAs at $708 and $729, respectively. This setup, along with the SuperTrend line at $766, a weak Relative Strength Index (RSI) around 39 and a negative Moving Average Convergence Divergence (MACD) histogram, suggests a broader bearish bias.
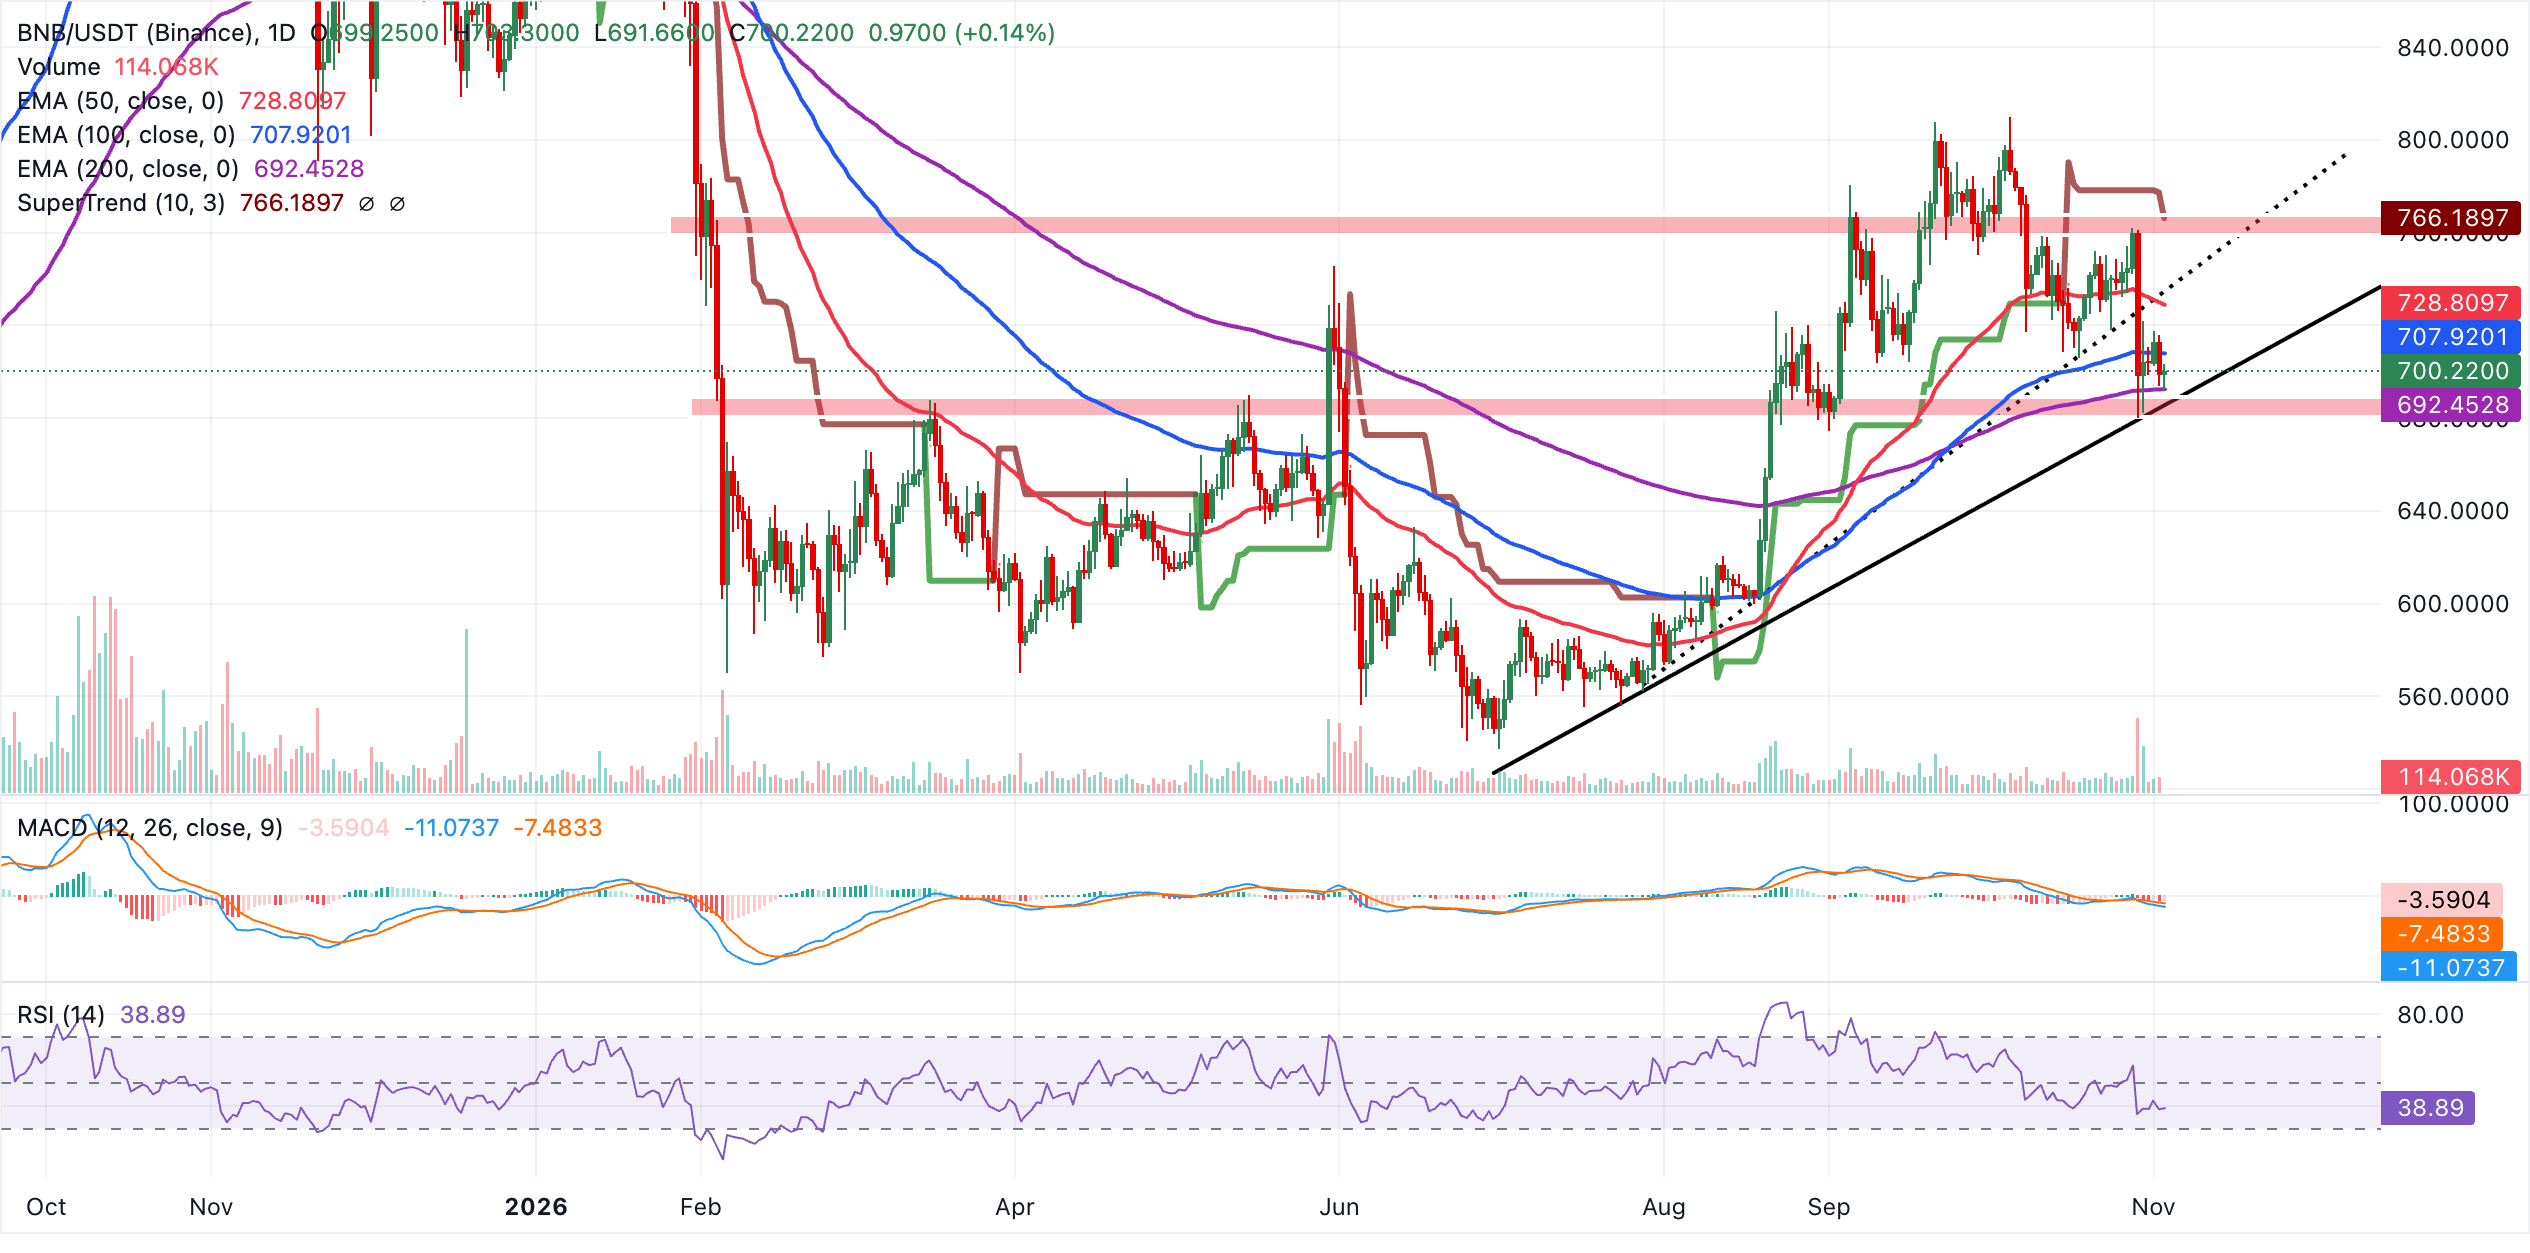
Initial resistance lies at the 100-day EMA around $708, followed by the 50-day EMA near $729. A more significant barrier is the broken rising trendline at $736, before the SuperTrend zone around $766 caps the advance. On the downside, the market finds near-term support at the reclaimed 200-day EMA near $692, with the earlier trendline-break area around $686 acting as a lower defensive level. Failure here would likely reopen room for a deeper pullback within the broader uptrend channel.
(The technical analysis of this story was written with the help of an AI tool. Know more.)
Open Interest, funding rate FAQs
Higher Open Interest is associated with higher liquidity and new capital inflow to the market. This is considered the equivalent of increase in efficiency and the ongoing trend continues. When Open Interest decreases, it is considered a sign of liquidation in the market, investors are leaving and the overall demand for an asset is on a decline, fueling a bearish sentiment among investors.
Funding fees bridge the difference between spot prices and prices of futures contracts of an asset by increasing liquidation risks faced by traders. A consistently high and positive funding rate implies there is a bullish sentiment among market participants and there is an expectation of a price hike. A consistently negative funding rate for an asset implies a bearish sentiment, indicating that traders expect the cryptocurrency’s price to fall and a bearish trend reversal is likely to occur.
Recommended Articles


