


Alphabet Q3 Earnings Preview: Revenue Expected to Grow 25%, Wall Street Highest Price Target at $485
TradingKey - Alphabet (GOOGL) will report its third-quarter 2026 financial results after the US market close on October 28. As demand for AI infrastructure continues to grow, Google Cloud is becoming a new growth engine for the company, but capital expenditures driven by data centers, servers, and custom chips are also climbing rapidly.
According to market expectations, Alphabet's third-quarter revenue is expected to reach approximately $127.9 billion, up nearly 25% year-over-year; earnings per share are projected at around $2.94, noticeably lower than the growth momentum reflected by revenue growth. It is worth noting that Alphabet's second-quarter EPS was boosted by large investment gains, so when comparing core earnings performance, operational health cannot be judged simply by year-over-year changes in reported EPS.
Stock performance also reflects shifting market sentiment. Since entering October, AI-related tech stocks have generally come under pressure as investors begin to reassess the rationale behind tech giants' continuously increasing capital expenditures. Although Alphabet possesses diversified revenue streams such as search advertising, subscription services, and cloud computing, cash flow and valuation could still face pressure if investments in AI infrastructure continue to outpace revenue growth.
Google Cloud Remains Largest Growth Engine
Alphabet's most standout business performance in the second quarter came from Google Cloud, where revenue grew 82% year-over-year to $24.8 billion, significantly outpacing the group's overall growth rate; operating income reached $8.8 billion, with the operating margin rising to 35.6% from 20.7% in the same period last year. This indicates that the growth of the cloud business is not only driven by expanding revenue scale, but is also beginning to demonstrate stronger profitability.
More notably, Google Cloud's remaining performance obligations reached $514 billion, increasing by more than $50 billion in a single quarter. The company expects about half of this amount to be converted into revenue over the next two years, providing high order visibility for the cloud business. However, this massive backlog can only be truly reflected in financial statements once data center capacity, chip supply, and project deployments are aligned.
JPMorgan expects that Google Cloud's third-quarter revenue could nearly double year-over-year, and raised its price target on Alphabet from $420 to $425. If the cloud business continues to maintain a growth rate close to 80% while keeping its operating margin stable at around 35%, it will show that Alphabet's investments in AI infrastructure are generating strong revenue and profit returns.
Can Search Advertising Support Massive AI Spending?
Google Search remains Alphabet's most important source of profit and cash flow. In the second quarter, Google Services revenue grew 15% to $94.5 billion, with Search and other advertising revenue rising 17% and YouTube advertising revenue gaining 13%.
As AI Overviews and Gemini are gradually integrated into search products, the market has been concerned that conversational AI could reduce traditional web page clicks, thereby weakening the commercial value of search advertising. Alphabet needs to prove that generative AI, far from disrupting its search business, actually boosts user engagement, increases commercial queries, and creates new advertising opportunities.
Year-over-year comparisons in the third quarter will be tougher, as Google Search revenue growth previously slowed from 19% to 17%. If it can maintain mid-double-digit growth this quarter, it will help ease concerns about AI chatbots diverting search traffic. However, if search growth slows significantly, even strong performance from Google Cloud may not fully offset the pressure on the core advertising business.
Subscription services such as YouTube Music, YouTube Premium, and Google One provide Alphabet with recurring revenue beyond advertising. Whether the subscription business can continue to expand will also influence market judgment on the company's revenue structure and growth stability.
Capital Expenditures and Free Cash Flow Remain the Biggest Risks
Alphabet has raised its 2026 capital expenditure guidance from $180 billion–$190 billion to $195 billion–$205 billion. The company's capital expenditures reached $80.6 billion in the first half of the year, more than doubling from $39.6 billion in the same period last year, with single-quarter spending in the second quarter reaching approximately $44.9 billion.
Based on the midpoint of its full-year guidance, Alphabet's capital expenditures in the second half of the year could approach $119 billion, equivalent to an average of roughly $60 billion per quarter. As data centers gradually come online, costs related to depreciation, energy, and maintenance will also progressively hit the income statement, potentially limiting further expansion of operating margins.
In the second quarter, Alphabet's free cash flow was negative at approximately -$5.9 billion, a key reason behind the significant rise in market concerns. The company also raised funds through common stock and mandatory convertible preferred stock, and plans to launch a new at-the-market equity offering program. For Alphabet, which has long relied on share buybacks to reduce its share count, if capital expenditures begin to depend on equity financing, both earnings-per-share growth and buyback capacity could be impacted.
Meanwhile, Wall Street overall remains optimistic about Alphabet's medium-to-long-term prospects. According to TipRanks, among the 26 analysts covering the stock over the past three months, the average 12-month price target is $427.25, with a high target of $485 and a low target of $380.
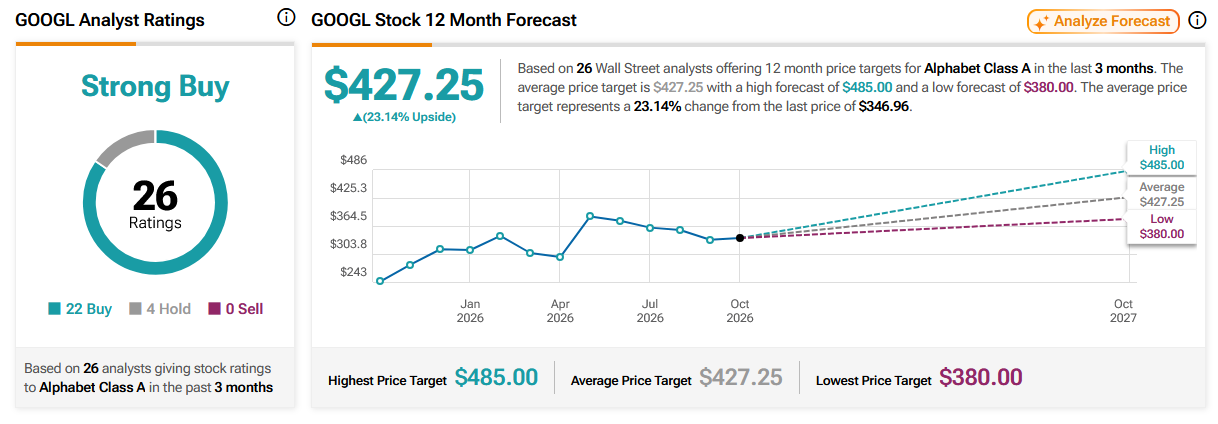
Source: TipRanks
Recommended Articles


