

S&P 500 Index Forecast: Morgan Stanley Says US Stock Pullback Is Nearing an End, Focus on 7,500

Source Tradingkey

TradingKey - At the close last Friday (October 16), the S&P 500 Index fell 1.09% to 7,659.44 points, down 1.95% for the week, primarily impacted by a sell-off in AI-related tech stocks, rising borrowing costs, and the market's reassessment of returns on AI capital expenditures. Entering pre-market trading on October 19, U.S. stocks rebounded, with S&P 500 futures rising by around 0.5% at one point. As the index approached 7,600 points again, Morgan Stanley (MS)'s assessment that the current U.S. stock market correction may be entering its late stage has drawn renewed attention.

Morgan Stanley: Current Pullback Is Nearing an End, but Interest Rates Remain a Key Variable

Morgan Stanley chief US equity strategist Mike Wilson previously noted that US stocks have already undergone months of a "rolling correction." He stated that if bond market volatility fails to decline, the S&P 500 could still experience an index-level pullback of 5% to 10%, though he believes such a drop could mark the final phase of this months-long correction. Wilson maintains that the current environment represents a mid-cycle correction within a bull market, rather than the end of the broader trend.

Although the S&P 500 is still up by about 11.9% this year, market performance under the surface is noticeably weaker than the index itself. Recent data indicates that around 62% of S&P 500 constituents have fallen below their 50-day moving average, with index performance still supported by a small number of large tech and AI-related companies. Third-quarter earnings for S&P 500 companies are currently projected to grow by roughly 30.6% year-over-year, but excluding certain major tech companies, overall earnings growth slows significantly.

Therefore, whether the market can conclude its correction mainly hinges on two key factors: first, whether corporate earnings can demonstrate that AI capital expenditures are translating into revenue and cash flow, with results from major tech firms such as Meta and Tesla this week providing a fresh benchmark; second, whether US Treasury yields can continue to retreat, given that the 10-year Treasury yield recently crossed 5%, increasing discounting pressure on stock valuations. Morgan Stanley recently maintained its year-end target of 8,000 points for the S&P 500, while expressing a preference for large, high-quality companies with stable earnings and high free cash flow.

S&P 500 Index Technical Analysis
B-ae3cd7d803c94d28bc77208f22131ee5

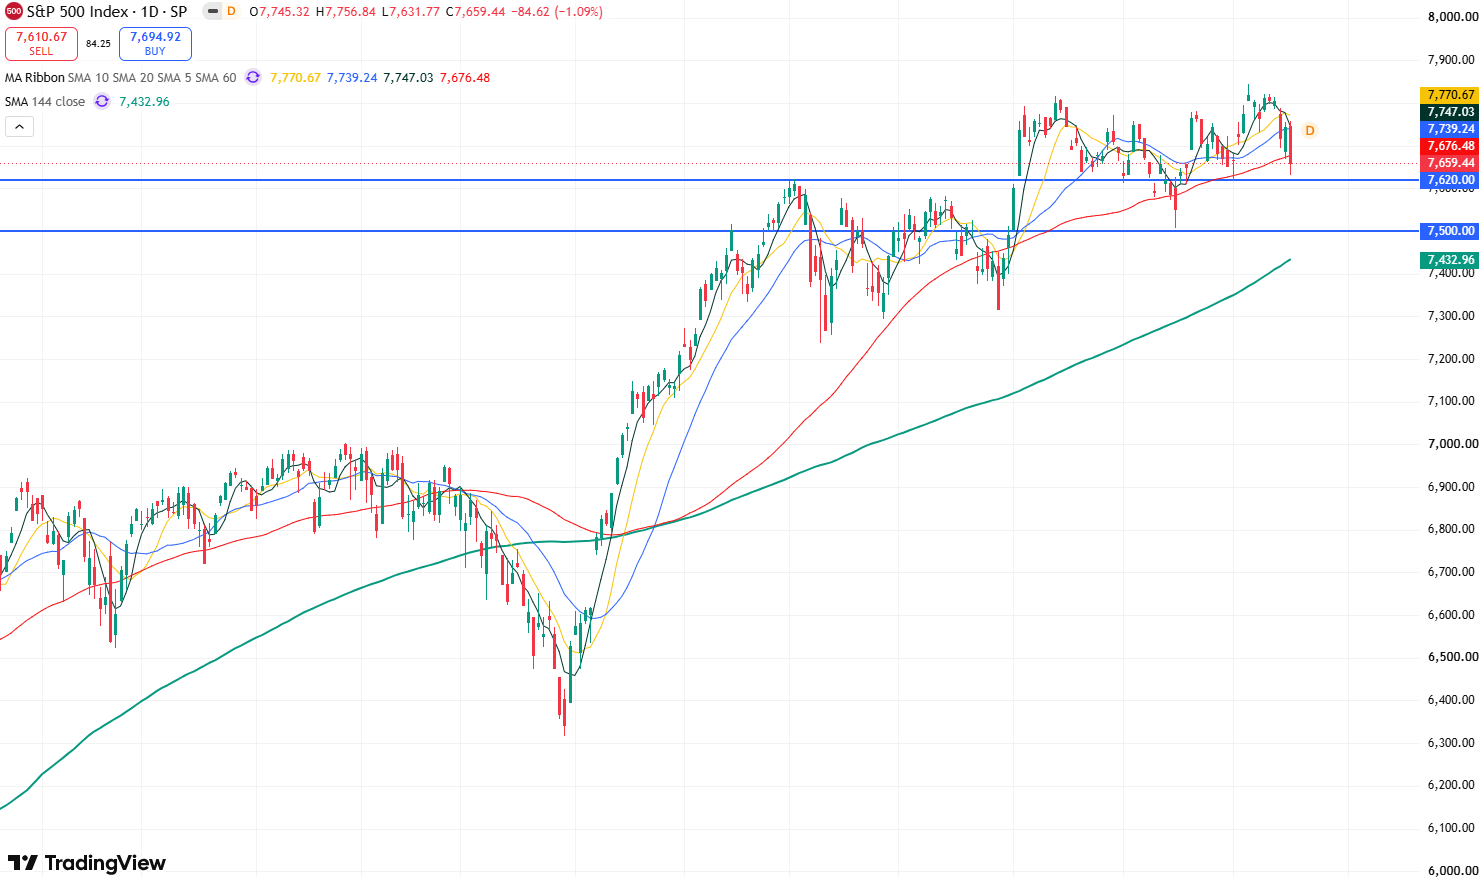
S&P 500 Index daily chart, Source: TradingView

Looking at the daily chart of the S&P 500 Index, following last Friday's sharp drop, the index has successively broken below its 10-day, 20-day, and 60-day moving averages. This tilts the short-term candlestick structure toward a bearish stance, suggesting that further downside remains possible in the near term.

In terms of technical indicators, the Relative Strength Index (RSI) has dropped to around 44, placing it in neutral-to-weak territory. However, it has not yet entered oversold territory, indicating that the index could continue to decline in the short term.

Currently, the primary support level to watch on the downside is 7,610. If this level fails to hold, the index may pull back to test the September 16 low near 7,500. A breach below this mark could open up room for a deeper correction.

On the upside, if the index stabilizes above 7,600 and reclaims 7,700, the next step would be breaking through the 20-day moving average resistance level at 7,740; looking further ahead, attention will turn to the 7,800–7,845 range.

Disclaimer: For information purposes only. Past performance is not indicative of future results.
placeholder
Brent Crude Oil Price Forecast: Trump Eases Sanctions on Russia, Oil Prices Under Pressure Below $110, Can They Still Rise?On Monday (October 19), Brent (UKOIL) crude oil prices fell noticeably at the open today after a sharp rally last Friday. As of press time, oil prices were down about 2.1%, trading near $
Author  TradingKey
8 hours ago
On Monday (October 19), Brent (UKOIL) crude oil prices fell noticeably at the open today after a sharp rally last Friday. As of press time, oil prices were down about 2.1%, trading near $
placeholder
Bitcoin's double top at $88,000: why $78,000 is the line that decides the next moveBitcoin trades near $82,500 (+0.47%) after twice failing at the $88,000 area, forming a potential double top with a neckline at $78,000. A break below the neckline would project a measured target near $68,200; a close back above $88,000 would invalidate the pattern. Here are the structure, the levels and what would confirm either side.
Author  Suzie
12 hours ago
Bitcoin trades near $82,500 (+0.47%) after twice failing at the $88,000 area, forming a potential double top with a neckline at $78,000. A break below the neckline would project a measured target near $68,200; a close back above $88,000 would invalidate the pattern. Here are the structure, the levels and what would confirm either side.
placeholder
Brent slips from $110 as Russian supply prospects return — is the five-month rally over?Brent crude traded near $108.06 on Monday (-1.71%), pulling back from last week's $110 high after Washington moved to ease restrictions on Russian oil flows. WTI hovered around $101 before dipping below $99. The retreat is real, but so is the supply-risk premium: Hormuz shipping disruptions, attacks on Saudi energy infrastructure and strikes on Russian refineries remain live. Here are the three numbers, the transmission chain and the levels that matter.
Author  Irene Q.
12 hours ago
Brent crude traded near $108.06 on Monday (-1.71%), pulling back from last week's $110 high after Washington moved to ease restrictions on Russian oil flows. WTI hovered around $101 before dipping below $99. The retreat is real, but so is the supply-risk premium: Hormuz shipping disruptions, attacks on Saudi energy infrastructure and strikes on Russian refineries remain live. Here are the three numbers, the transmission chain and the levels that matter.
placeholder
Gold retests $4,200 as dollar and yields retreat — can bullion clear its hardest level?Spot gold traded near $4,175 on Monday (+0.23%), with an intraday high of $4,187.71 after last week's $4,073 ~ $4,217 range; COMEX futures briefly topped $4,200. The dollar slipped to 101.76 and 10-year yields eased from their highs, but October Fed hike odds near 52% and BofA's sub-$4,000 call still cap the upside. Here are the drivers, the levels and what would flip the script.
Author  Irene Q.
12 hours ago
Spot gold traded near $4,175 on Monday (+0.23%), with an intraday high of $4,187.71 after last week's $4,073 ~ $4,217 range; COMEX futures briefly topped $4,200. The dollar slipped to 101.76 and 10-year yields eased from their highs, but October Fed hike odds near 52% and BofA's sub-$4,000 call still cap the upside. Here are the drivers, the levels and what would flip the script.
placeholder
Gold Price Analysis Today | Forex Gold Analysis | XAU/USD Analysis - October 19, 2026Get the latest gold price analysis, forex gold insights, and XAU/USD analysis for October 19, 2026. Read on for the details.
Author  Mitrade
17 hours ago
Get the latest gold price analysis, forex gold insights, and XAU/USD analysis for October 19, 2026. Read on for the details.
goTop
quote