


Bloom Energy Stock Forecast: BE Surges Nearly 11%, Can AI Data Center Power Demand Keep Driving the Stock Higher?
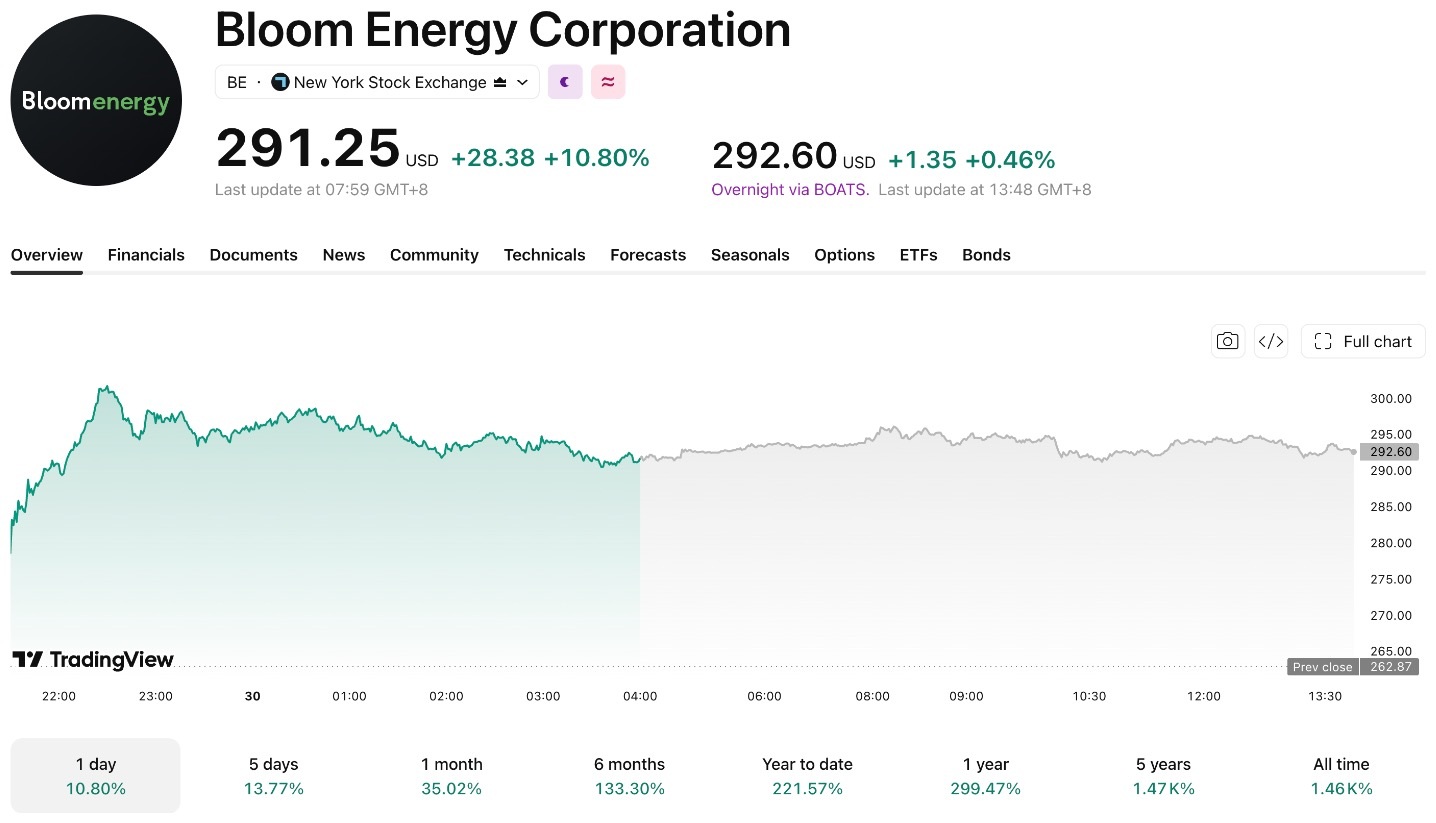
TradingKey - On September 29 ET, Bloom Energy (BE) closed up 10.8% at $291.25, hitting an intraday high of $302.25, with trading volume reaching approximately 23.69 million shares, significantly above recent average levels. In the previous trading session, BE dropped 8.95%, indicating a marked increase in stock price volatility at elevated levels.
[Source: TradingView]
According to disclosures from the City of Fremont, Bloom Energy has acquired a local facility of approximately 158,000 square feet to expand its operations and expects to add hundreds of advanced manufacturing jobs. The specific usage, additional capacity, and production timeline have not yet been announced.
Morgan Stanley analyst David Arcaro believes the expansion reflects continued strong demand for the company's products. Jefferies maintained its "Hold" rating and raised its price target from $229 to $264, which remains below BE's latest closing price.
AI Data Center Power Shortages Drive Demand for On-Site Power
Power consumption by AI server clusters continues to rise, while construction cycles for grid connection and transmission infrastructure remain lengthy, leading some data centers to adopt on-site power generation solutions. Bloom Energy's solid oxide fuel cells can generate electricity at customer sites, reducing reliance on additional grid capacity, though projects still need to secure fuel supplies and obtain relevant permits.
The master service agreement signed between Oracle and Bloom Energy covers up to 2.8 GW of fuel cell systems, of which 1.2 GW has been contracted and deployment has begun, with the remaining capacity depending on subsequent procurement and project progress. Bloom Energy and Brookfield also expanded their AI infrastructure project financing framework from $5 billion to $25 billion, with specific capital to be deployed as projects advance.
Bloom Energy stated that its AI infrastructure business has served nearly 24 customers, representing approximately 250 MW of capacity. Company management also noted that major U.S. hyperscalers, along with more than a dozen AI cloud providers, AI labs, and data center operators, have validated and approved its power supply solutions.
Revenue Grows 166% as Project Delivery Becomes Key
Bloom Energy's second-quarter revenue reached $1.065 billion, up 165.5% year-over-year; GAAP gross margin rose from 26.7% to 33.4%, and operating cash flow was $226.4 million. The company raised its 2026 revenue guidance to $3.9 billion to $4.2 billion, with the midpoint representing year-over-year growth of approximately 100%; non-GAAP EPS guidance was set at $2.55 to $2.85.
Based on a market capitalization of approximately $94.2 billion as of September 29 and the midpoint of the revenue guidance at $4.05 billion, BE's trailing price-to-sales ratio is approximately 23.3x. The current valuation requires the company to maintain relatively rapid growth and complete capacity expansion and large-scale project deliveries as planned.
Key focus areas going forward include the intended use and commissioning schedule for the new Fremont facility, whether the remaining 1.6 GW of capacity under agreement with Oracle can be converted into firm purchases, and changes in gross margin. In addition, natural gas pipelines, air quality permits, and construction progress for projects such as Project Jupiter may also impact equipment deployment and revenue recognition timing.
BE Technical Analysis: $302-$305 Becomes Major Resistance Zone
As of the close on September 29, BE traded at $291.25, after touching an intraday high of approximately $302.3.
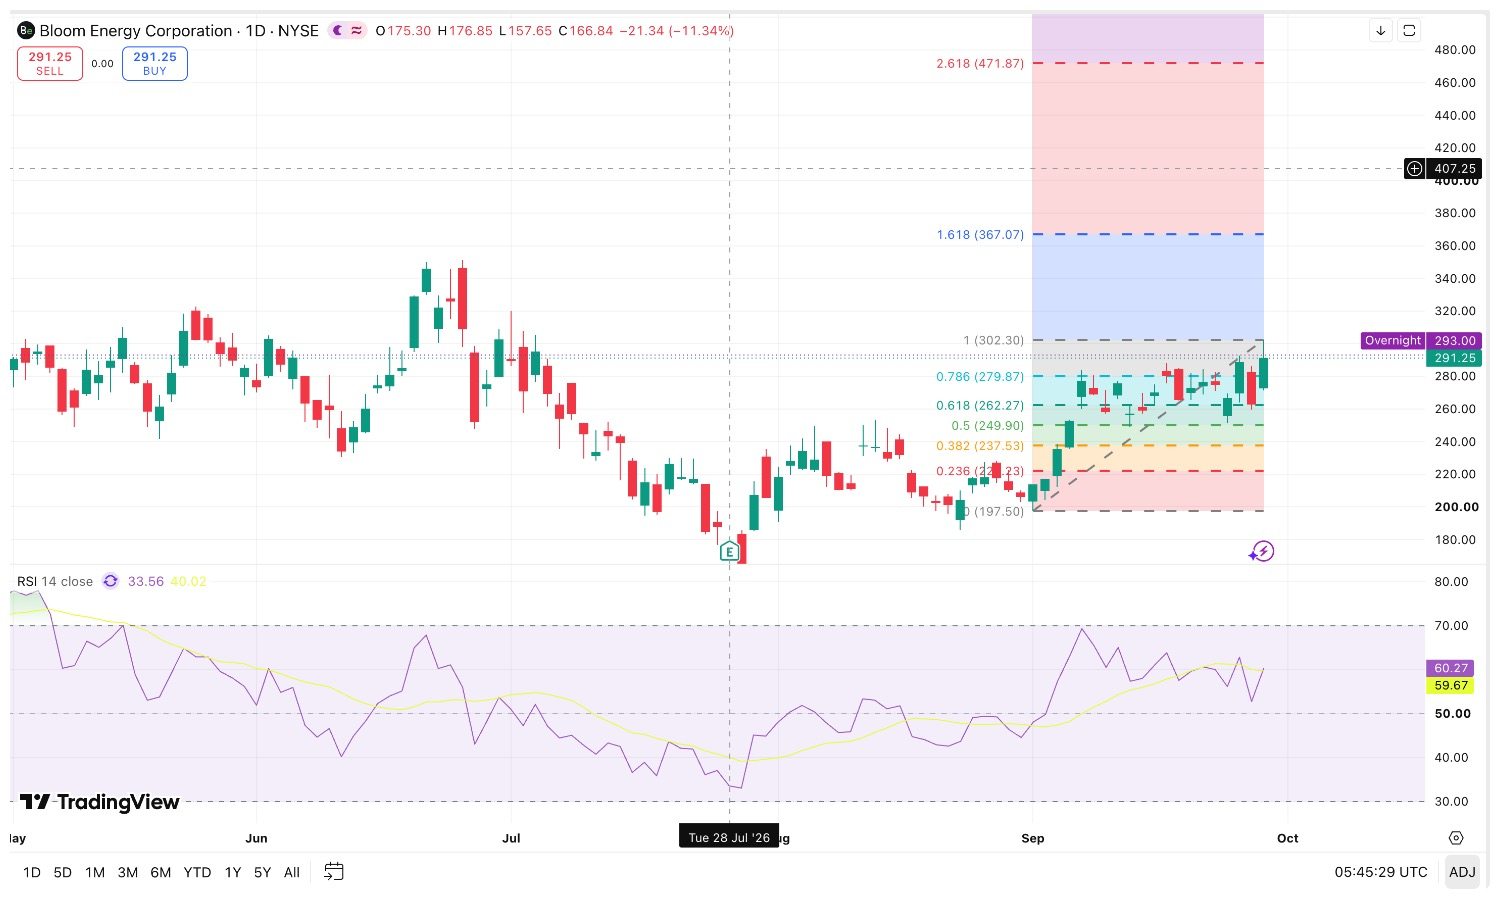
Calculated from the intraday low of $197.50 on September 1 to the intraday high of approximately $302.3 on September 29, the Fibonacci 0.236, 0.382, 0.500, and 0.618 retracement levels are approximately $279.87, $262.27, $249.9, and $237.53, respectively.
[Source: TradingView]
To the upside, $302–$305 is currently the primary resistance zone. If BE closes above $305 on heavy volume, the next level to watch is $330–$331, corresponding to the 1.272 Fibonacci extension level; following a further breakout, attention can turn to the 1.618 extension level at around $367.
To the downside, $288–$293 is the short-term breakout confirmation zone, where $288 is the previous pattern breakout level and $292.72 is a prior period high. If the stock price falls below this area, the next support to watch is $277–$278; if it continues to weaken, watch $262 and $250 in turn.
On September 28, BE touched an intraday low of $259.46 and closed at $262.87, with the closing price near the 0.382 retracement level of $262.27. This level can serve as an important observation zone for subsequent pullbacks.
In the short term, if BE holds firmly above $305, attention can further extend to $330–$331; if it breaks below $277, the bullish structure will weaken, with a potential retest near $262.
Recommended Articles


