


【Daily Brief】The dollar ground higher for six days — and the AUD fell 2% in the very week the RBA hiked to a 15-year high

Mitrade Insights — The dollar index is sitting at 100.999, and the shape of its move matters more than the level. This is not a one-day dollar surge that a single reversal can undo — it is a six-session grind in which every swing high and every swing low has moved higher. Over that same stretch the Australian dollar has become the worst performer among the majors, down 2.02%, and it did so in the week the Reserve Bank of Australia raised its cash rate to 4.60%, a 15-year high. A currency that got a rate hike and still fell is the single most informative fact on the board this week.
Data as of the Asia session on 30 September 2026. The dollar index is a Capital.com difference contract; AUD/USD and USD/JPY are OANDA spot rates, so index and spot levels are not directly comparable.
The dollar's shape: a grind, not a jump
The dollar index path since 21 September reads 100.43 → 101.10 → 100.97 → 101.20 → 101.37, and it is now holding at 100.999 after touching 101.086 intraday. That is roughly 0.94% over six sessions with no single outsized day in it.
Slow dollar moves are harder to trade against than fast ones. A spike can be unwound in a session; a staircase of higher highs and higher lows means capital is continuously being converted into dollars, and anyone holding the other side is paying a rising carry cost every day they wait for a pullback. The driver is straightforward on the rates side: the 30-year Treasury yield closed at 5.59% on 29 September, the highest since June 2002, and has risen for six consecutive sessions. Nothing in the rate path is arguing for a softer dollar near term.
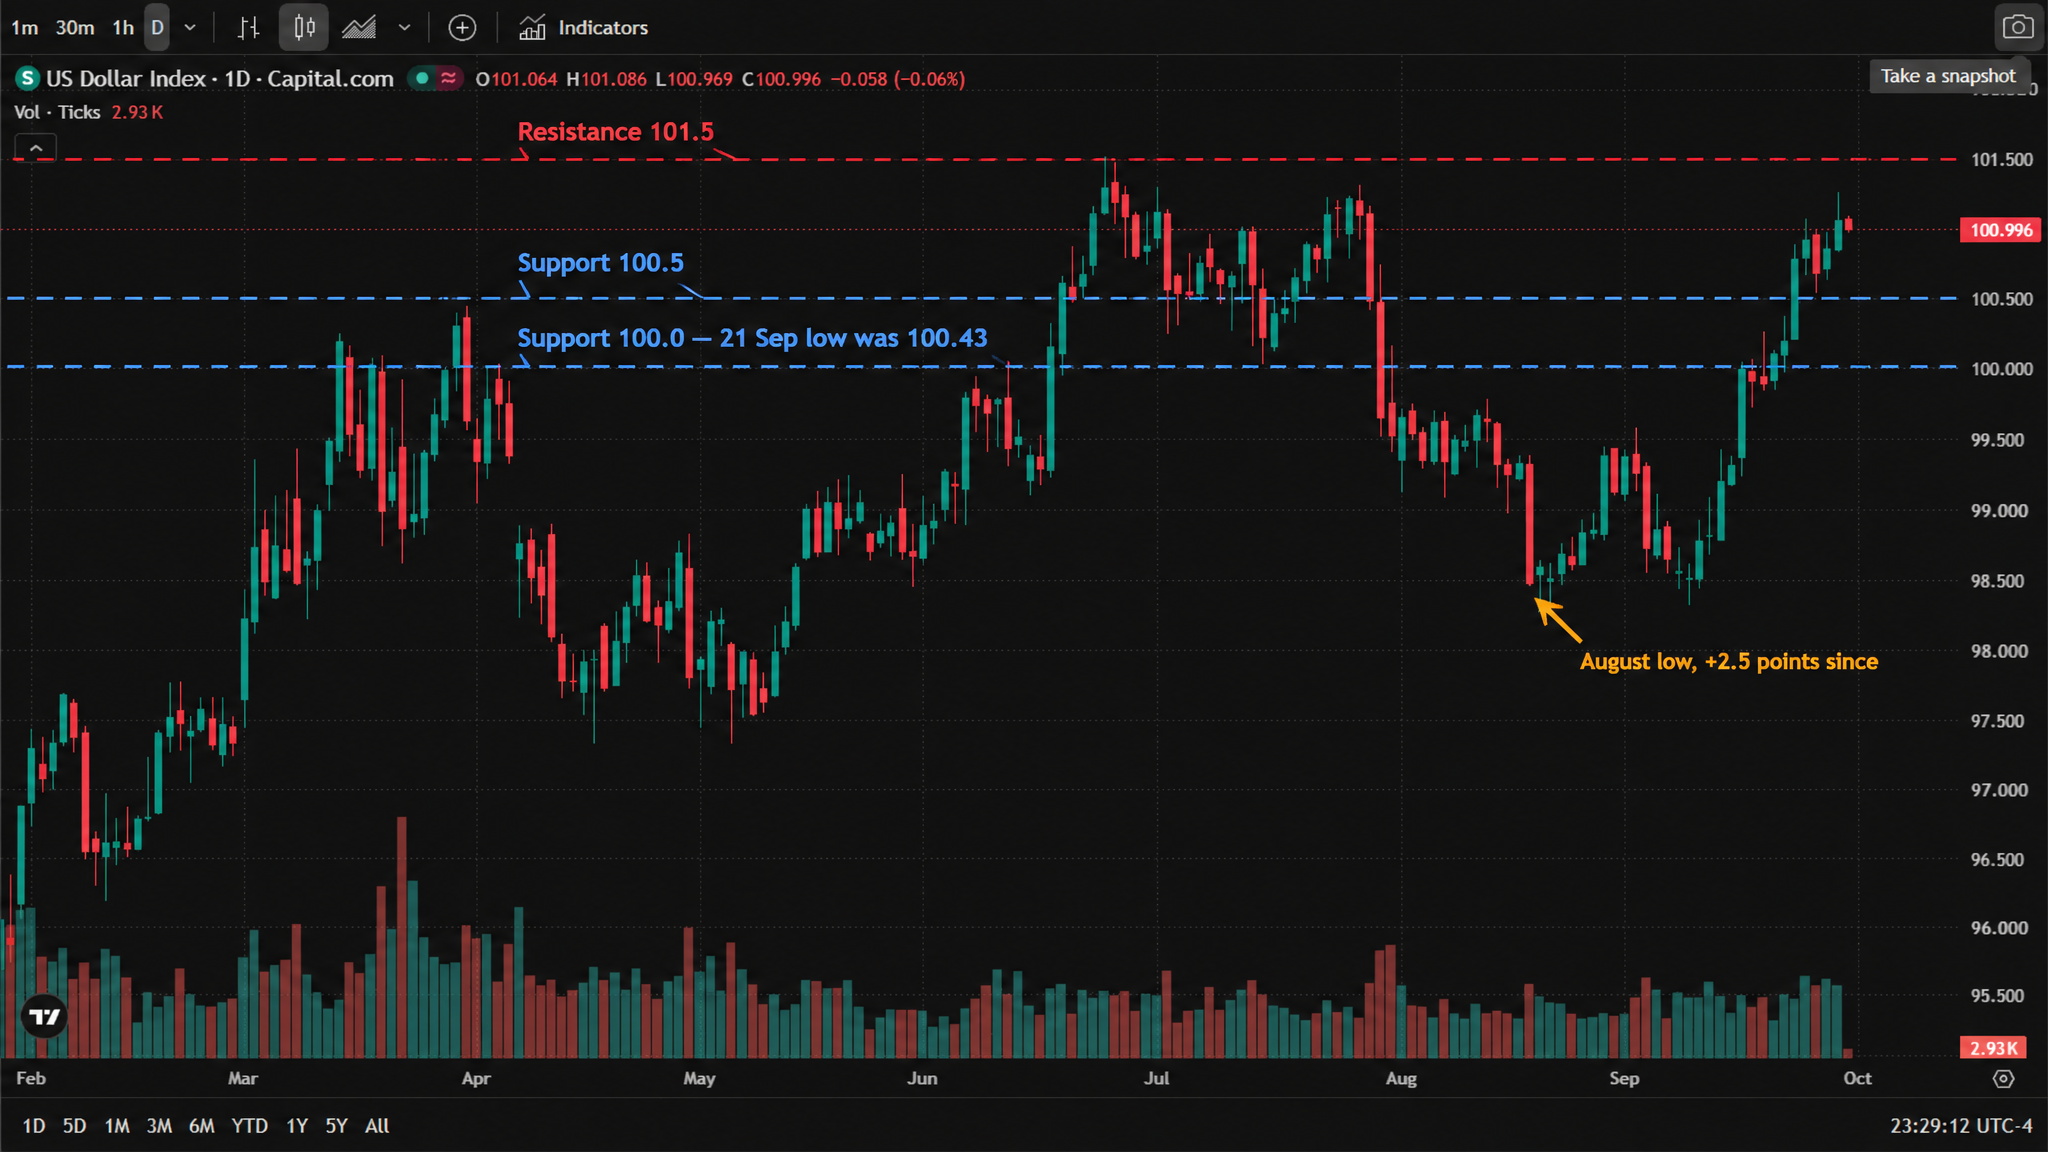
* Chart source: TradingView official chart screenshot, data provider Capital.com (US Dollar Index difference contract).
The AUD paradox: hiked, and still the worst performer
On 29 September the RBA raised its cash rate target by 25bp to 4.60% — the highest since November 2011 and the fourth hike of 2026 — in a unanimous decision whose statement retained the hawkish line that the Board will do "what it considers necessary to bring inflation sustainably back to target, including increasing the cash rate target further if needed".
Then Governor Michele Bullock's press conference rewrote the message. AUD/USD spiked to 0.7030 on the decision, then reversed hard during the presser, broke below 0.7000 and bottomed at 0.69584. Bullock revealed the Board had seriously considered holding, citing housing-market risk and a potentially slower global economy, and repeatedly stressed that the four hikes delivered this year may already be sufficiently restrictive. ING's Francesco Pesole called the presser "dovish taint"; TD Securities framed the decision as a "risk management hike" rather than the start of a new tightening cycle.
Australian CPI landed the following morning at 4.0% year on year, up from 3.5% but below the 4.1% consensus — and, critically, the trimmed mean was unchanged at 3.6% for a third straight month. The composition explains why: the housing group rose 5.7% with electricity up 13.2%, and the transport group rose 5.6% with automotive fuel up 13.5%, which is an imported energy story rather than domestic demand. The Reserve Bank's preferred measure of underlying inflation did not move at all. LSEG rate pricing now puts the odds of a further hike at November below 20%.
The result: AUD/USD at 0.6976, a two-month low, down 2.02% from 0.7122 on 20 September. The rate hike delivered no support at all, because the market had priced it at roughly 92% beforehand and the news that mattered was the removal of the next hike.
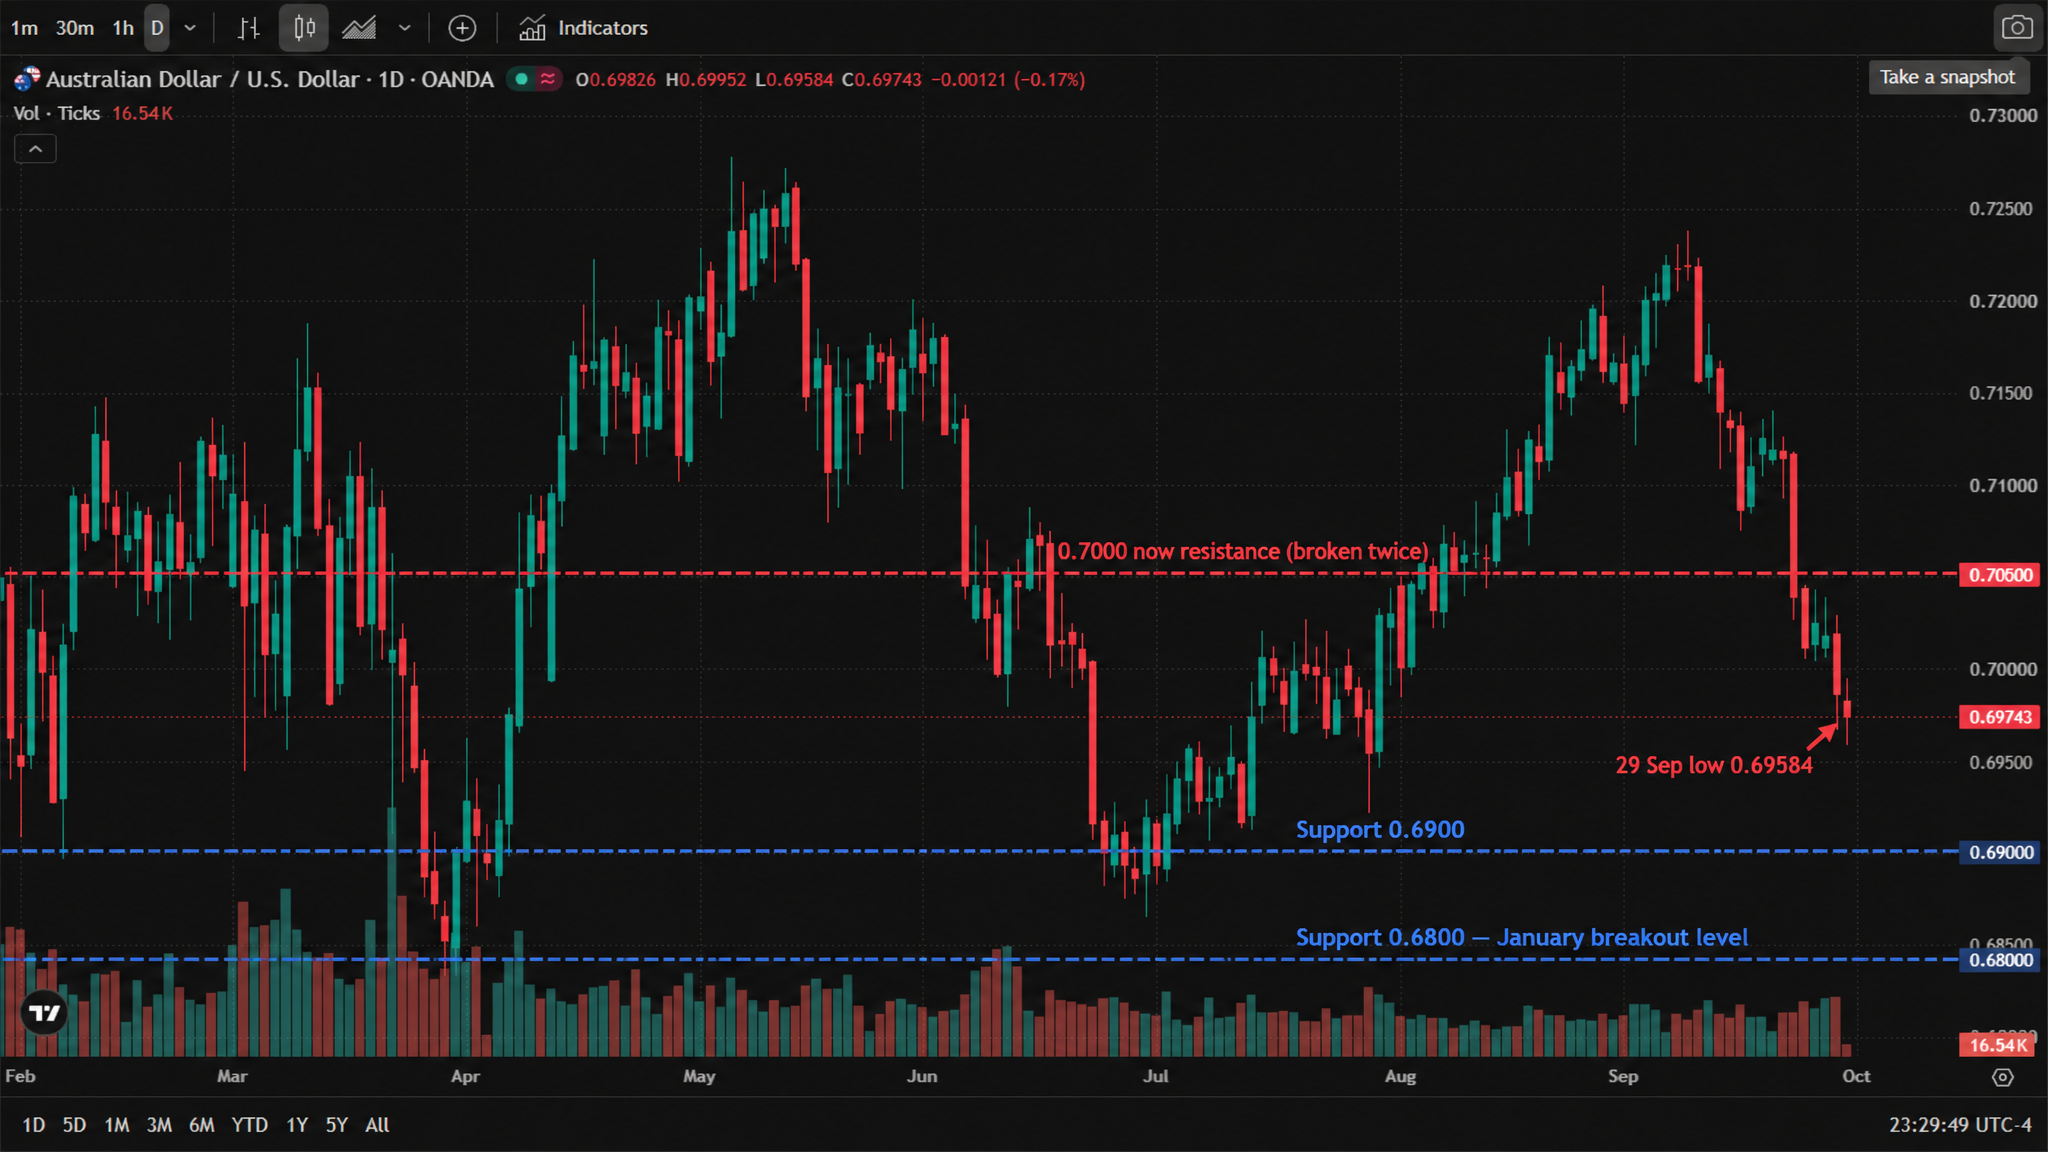
* Chart source: TradingView official chart screenshot, data provider OANDA (AUD/USD).
There is a third leg to this paradox. The S&P/ASX 200 rose about 0.8% on 30 September to roughly 8,778, its highest level since 10 September — on the same session the currency hit a two-month low. Australian equities have absorbed a rate hike, a 4.0% inflation print and a collapsing forward-hike price, and still closed higher. Equity investors are treating the tightening as fully priced; currency traders are treating it as the end of the tightening.
The distinction matters for anyone hedging. An investor who hedges an Australian equity book in AUD was protected on the currency and gained on the index. An investor who hedges an Australian income position was not — and the rate that was supposed to support that income, at 4.60% and the highest since 2011, now has a front-end market pricing roughly a 20% chance of being cut rather than raised by November.
The yen is the exception — and tonight is its test
The yen is the only major currency gaining over the six sessions, up 1.32% from the 24 September high of 158.811 to 156.587. USD/JPY has moved in the opposite direction to every other pair on the board, and it has an event attached.
At 7:00pm JST tonight (10:00am AEST), Japan's Ministry of Finance publishes the monthly foreign-exchange intervention total for 27 August to 28 September. This is the second monthly tally since the coordinated US-Japan yen-buying intervention of 31 July, which set a record. The previous disclosure, covering 30 July to 26 August, was ¥15.5393 trillion. Japanese official foreign reserves fell $79.575bn in August to $1.2075 trillion — the largest monthly decline since April 2000.
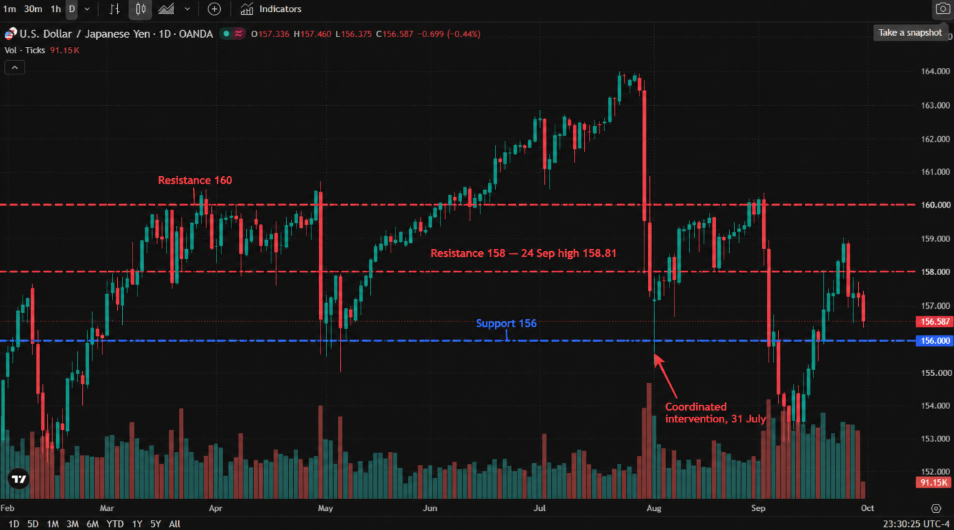
* Chart source: TradingView official chart screenshot, data provider OANDA (USD/JPY).
The rest of the board is following the same script
| Pair | Level (30 Sep Asia) | Six-session move from 20 Sep |
|---|---|---|
| AUD/USD | 0.6976 | −2.02% |
| EUR/USD | 1.1343 | −1.19% (three-month low) |
| GBP/USD | 1.3233 | −1.17% |
| USD/CAD | 1.4193 | CAD −1.42% |
| USD/JPY | 156.587 | JPY +1.32% |
EUR/USD at 1.1343 has broken below the 1.136 support that had held since mid-September, and desks are now looking at 1.1200 as the next downside level. The pattern across the developed-market complex is uniform: every currency except the yen has been sold to defend a dollar that is being pulled higher by a 24-year-high long-end yield. The exception is not accidental. The yen is the only currency on the board with an active, stated policy of leaning against further depreciation.
Tonight: two events, pulling in opposite directions
8:30am ET — US August PCE. Consensus is core PCE up 0.3% month on month (from 0.2%) and 3.3–3.4% year on year; the Cleveland Fed nowcast has core at 0.27% and 3.40%. This is the one input that can break the dollar's streak, and therefore the one that decides whether the AUD's decline continues.
7:00pm JST — Japan Ministry of Finance intervention total. Whatever the number, it either confirms that the July intervention is being sustained, which caps USD/JPY here, or shows the authorities were passive through a period of yen weakness, which puts 158 back in play.
The two are independent, and that is the point. The dollar index is a rates story driven by US data. The yen is a policy story driven by Japanese authorities. Positioning that assumes "a weaker dollar fixes everything" has to survive both.
Read more
* The content presented above, whether from a third party or not, is considered as general advice only. This article should not be construed as containing investment advice, investment recommendations, an offer of or solicitation for any transactions in financial instruments.


