

Zcash Price Forecast: ZEC stalls around $1,400 as easing upside momentum risks capitulation

Source Fxstreet
  • Zcash hovers around $1,400 on Wednesday after three consecutive days of losses totaling about 15%.
  • Grayscale’s ZEC-focused ETFs recorded over $8 million in outflows on Monday, ahead of its 3-for-1 stock split on Wednesday.
  • The technical outlook for ZEC indicates a near-term corrective bias, targeting the $1,300 support floor.

Zcash (ZEC) price stalls around $1,400 at press time on Wednesday, holding steady after a 15% decline over the last three consecutive days of losses. Early signs of easing institutional demand, with $8 million in outflows on Monday, back the near-term downside risk in the privacy coin. The technical outlook for ZEC indicates a potential dip toward the $1,300 support floor. 

Grayscale’s ZCSH inflows flip negative ahead of stock split

Grayscale’s Zcash Trust Fund Exchange Traded Fund (ETF), ticker ZCSH, announced a 3-for-1 stock split within its first month of trading. This decision is based on the strong bullish undercurrent, with over $250 million in inflows in the first 30 days of trading, totaling $21.83 million in August and $276.17 million so far in September. 

However, the ZCSH fund recorded zero inflow on Tuesday after $8.12 million in outflows on Monday, suggesting an early sign of easing institutional demand ahead of the stock split.
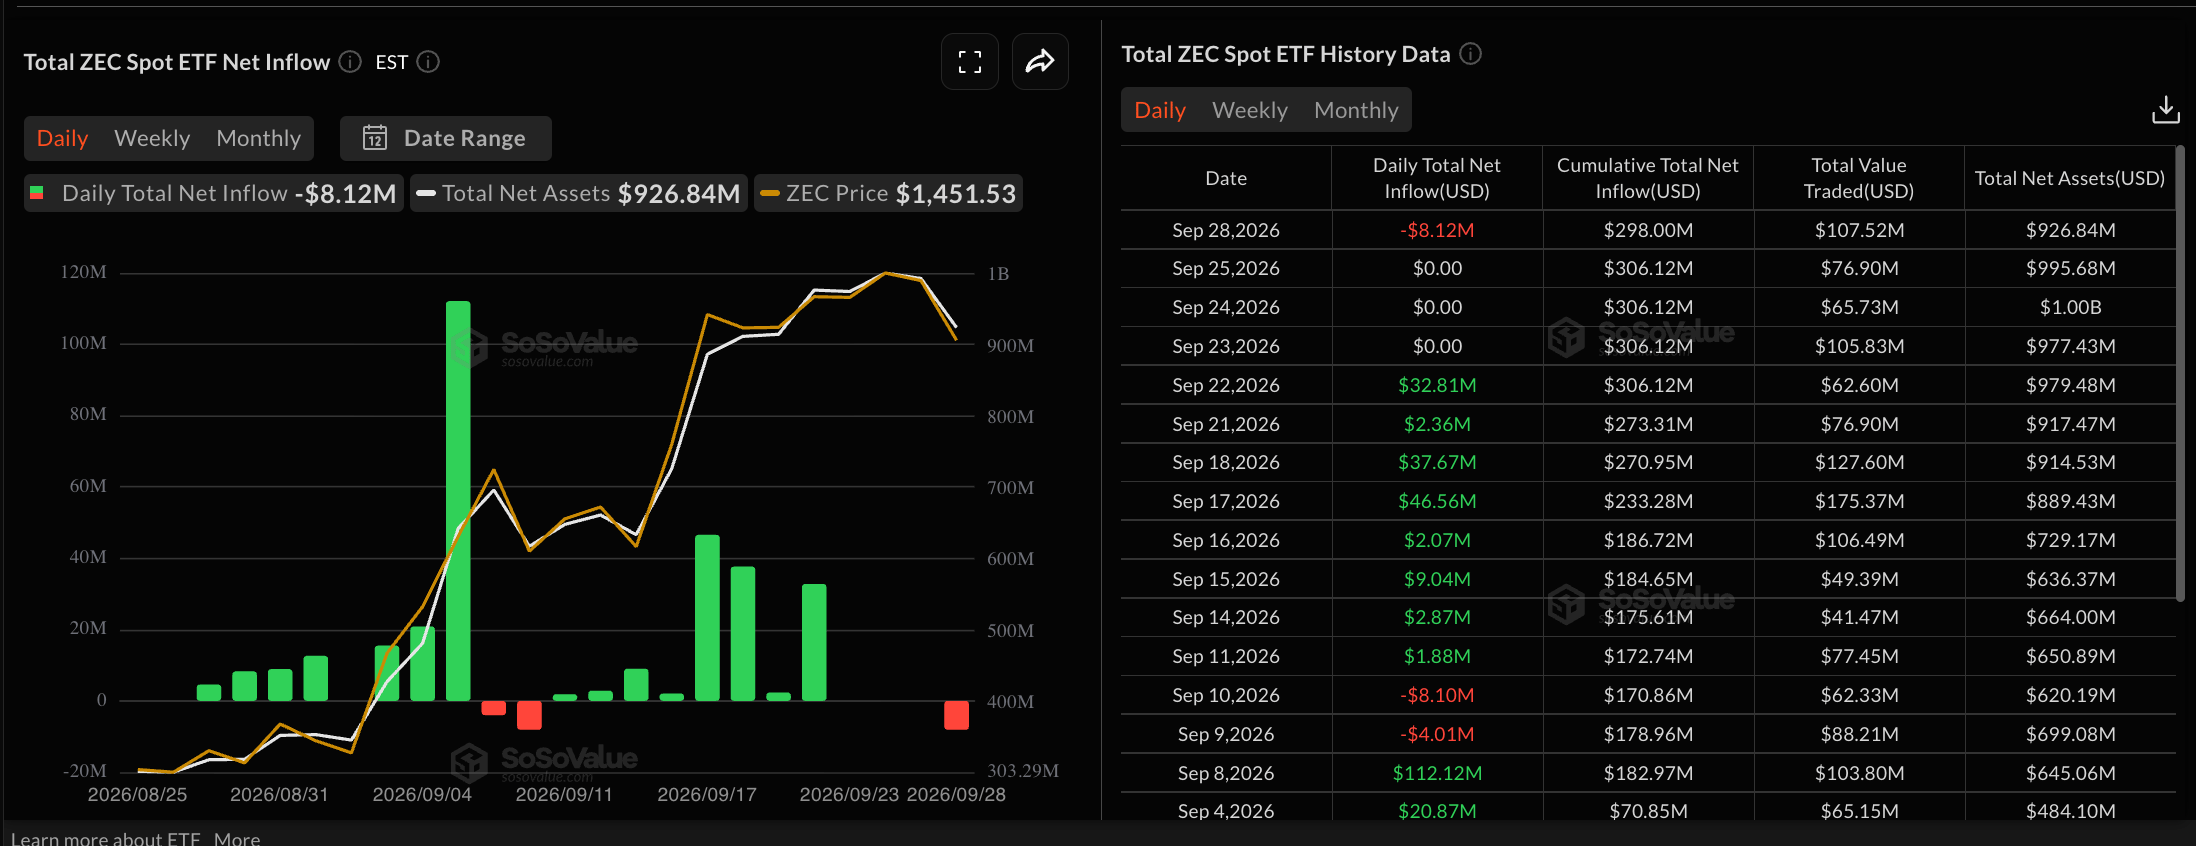
Zcash ETFs data. Source: Sosovalue

Technical outlook: Will Zcash hold above $1,300?

Zcash trades around $1,412 at press time on Wednesday, extending the pullback from Sunday's high of $1,698. The privacy coin maintains a near-term bearish bias after three consecutive days of losses totaling around 15%.

The price hovers below the 50- and 100-period Exponential Moving Averages (EMAs) on the four-hour chart at $1,494 and $1,425, respectively, while only the 200-period EMA at $1,254 underpins the broader structure. The path of least resistance targets a downside to the September 9 high at $1,296, reinforced by the 200-period EMA at $1,254, projecting a potential 10% downside risk.

The Moving Average Convergence Divergence (MACD) remains in negative territory with a bearish profile, and the Relative Strength Index (RSI) around 41 suggests subdued demand, reinforcing the risk of further downside.

Chart Analysis ZEC/USDT (Binance)
ZEC/USDT four-hour price chart.

On the topside, initial resistance aligns with the 100-period EMA at $1,425 ahead of a stronger barrier at the 50-period EMA near $1,494, where sellers could reassert control if the pair attempts a corrective bounce. A confirmed breakout above the overhead average lines could target the September 23 high at $1,679, which capped gains on Sunday.

(The technical analysis of this story was written with the help of an AI tool. Know more.)

Disclaimer: For information purposes only. Past performance is not indicative of future results.
placeholder
Gold Price Forecast: US August PCE Imminent, Will Gold Prices Rise or Fall Short-Term?As of the European session on September 30, gold prices (XAUUSD) continued to recover after a sharp drop earlier this week, reclaiming $4,200 intraday, with the latest price trading near
Author  TradingKey
7 hours ago
As of the European session on September 30, gold prices (XAUUSD) continued to recover after a sharp drop earlier this week, reclaiming $4,200 intraday, with the latest price trading near
placeholder
【Daily Brief】30-year Treasury tops 5.59%, S&P 500 slips to 7,670 and gold holds $4,180 — PCE lands tonightThe 30-year Treasury yield closed at 5.59%, its highest since June 2002, and the Dow fell 131.59 points to 51,349.92. US consumer confidence dropped to 81.9, a 12-year low, and JOLTS job openings fell to 7.1 million. August PCE and Q3 GDP both land at 8:30am ET tonight.
Author  Suzie
10 hours ago
The 30-year Treasury yield closed at 5.59%, its highest since June 2002, and the Dow fell 131.59 points to 51,349.92. US consumer confidence dropped to 81.9, a 12-year low, and JOLTS job openings fell to 7.1 million. August PCE and Q3 GDP both land at 8:30am ET tonight.
placeholder
【Daily Brief】The dollar ground higher for six days — and the AUD fell 2% in the very week the RBA hiked to a 15-year highThe dollar index held above 101 while the Australian dollar slid to a two-month low of 0.6976, a 2.02% six-session loss, even though the RBA raised rates to 4.60% and Australian CPI printed 4.0%. The yen is the only major currency gaining, ahead of Japan's monthly intervention tally at 7pm JST.
Author  Irene Q.
10 hours ago
The dollar index held above 101 while the Australian dollar slid to a two-month low of 0.6976, a 2.02% six-session loss, even though the RBA raised rates to 4.60% and Australian CPI printed 4.0%. The yen is the only major currency gaining, ahead of Japan's monthly intervention tally at 7pm JST.
placeholder
WTI remains below $90.00 due to Middle East export recoveryWest Texas Intermediate (WTI) oil price edges higher after registering nearly 4.5% losses in the previous day, trading around $88.50 per barrel during Asian hours on Wednesday. Crude oil prices eased as energy flows from the Middle East showed clear signs of improvement.
Author  FXStreet
15 hours ago
West Texas Intermediate (WTI) oil price edges higher after registering nearly 4.5% losses in the previous day, trading around $88.50 per barrel during Asian hours on Wednesday. Crude oil prices eased as energy flows from the Middle East showed clear signs of improvement.
placeholder
Gold Price Forecast: Gold Plunges to Seven-Week Low, Can $4,100 Hold? Spot gold (XAUUSD) plunged 4% on Monday to close at $4,114.93 per ounce, hitting an intraday low of $4,110.80, its lowest level since August 5. Heading into Tuesday's Asian trading sessio
Author  TradingKey
Yesterday 09: 16
Spot gold (XAUUSD) plunged 4% on Monday to close at $4,114.93 per ounce, hitting an intraday low of $4,110.80, its lowest level since August 5. Heading into Tuesday's Asian trading sessio
goTop
quote