


Should You Really Invest in the Stock Market Right Now? History Offers a Clear Answer
Key Points
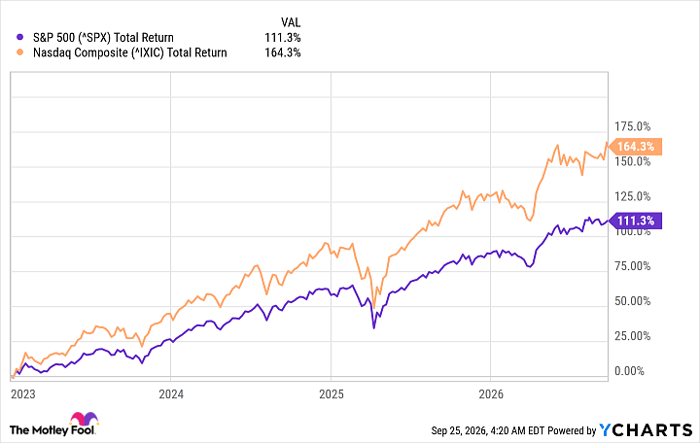
The S&P 500 and the Nasdaq Composite have both more than doubled since the beginning of 2023.
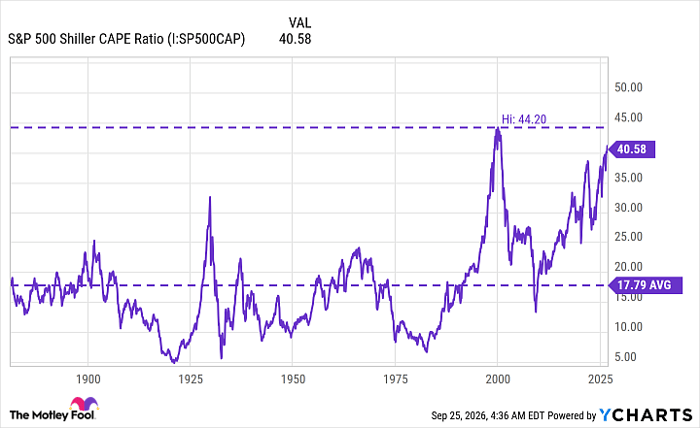
The S&P 500's Shiller CAPE ratio has only been higher than it is now during one brief period in history, but that doesn't necessarily mean the market has peaked.
Market timing doesn't work as a strategy, but steady investing does.
- 10 stocks we like better than S&P 500 Index ›
The S&P 500 (SNPINDEX: ^GSPC) and the Nasdaq Composite (NASDAQINDEX: ^IXIC) have been hitting new highs this year, driven by developments in artificial intelligence and a buoyant feeling about future earnings. There has been a strong bull market for nearly four years, and both stock market indexes have demonstrated incredible growth during this time. If you'd done no investing except for in an exchange-traded fund (ETF) that tracks one of those two benchmark indexes, you'd have more than doubled your money in less than four years.
Missed AI’s "Act 1"? Act 2 Could Be 15x Bigger. Most investors think they missed the AI boat because they didn't buy Nvidia in 2005. But according to our analysts, we’re only at the end of "Act 1"—the R&D phase. "Act 2" is the global rollout. Continue »
^SPX data by YCharts.
Smart investors know, though, that it's better to buy low than high. However, there's a caveat to that principle that will help clarify whether or not this is a good time to invest in the stock market.
Buy at the high?
First of all, this isn't necessarily the high. One of the metrics that looks foreboding right now is the Shiller CAPE ratio -- aka, the cyclically adjusted price-to-earnings ratio. That metric weighs the S&P 500's value against its past decade of earnings, adjusted for inflation, making it a more reliable measure of how expensive the market is. The market's average CAPE ratio over the past century and a half is 17.8, and it has only topped 40 twice: The first time was in late 1999 and early 2000, right before the dot-com bubble burst and the S&P 500 lost nearly half of its value. The second time was this year.
S&P 500 Shiller CAPE Ratio data by YCharts.
There's no way to know how long the market can keep rising even from these levels. In early 2000, the CAPE ratio hit 44 before the market crashed. This month, it reached 41.
Buy all the time
The one principle that trumps the premise that you should buy low is that you should invest consistently -- because you can't and won't know when the lows and highs are coming. Historically, trying to time the market hasn't produced the best results. On occasion, someone can get lucky, but hoping that you'll be able to make a habit of it is not a path toward successful investing. So while, of course, buying only at the lows and selling at the highs would produce ideal results, doing that in practice in any consistent way is an impossibility.
However, studies have shown that what you can do consistently -- investing regularly at a steady pace -- delivers results that don't come in too far behind ideal trading. And it's a low-stress, low-effort method, too.
Schwab did a study last year based on five investing styles over 20 years. The perfect timer came in first, turning investments of $2,000 a year into a portfolio worth $186,000. However, all the remaining three styles outside of the one who didn't invest at all came in pretty close; a consistent investor who added to their portfolio just once a year ended up with $170,000, and a person using a dollar-cost averaging strategy and investing monthly grew their portfolio to $166,000. Even the "poor timing" investor who only bought in on each year's highest day ended up with $151,000.
The message is clear: Continued investing, even at times when the market is at its high points, can lead to successful results.
Should you buy stock in S&P 500 Index right now?
Before you buy stock in S&P 500 Index, consider this:
The Motley Fool Stock Advisor analyst team just identified what they believe are the 10 best stocks for investors to buy now… and S&P 500 Index wasn’t one of them. The 10 stocks that made the cut could produce monster returns in the coming years.
Consider when Netflix made this list on December 17, 2004... if you invested $1,000 at the time of our recommendation, you’d have $383,680!* Or when Nvidia made this list on April 15, 2005... if you invested $1,000 at the time of our recommendation, you’d have $1,382,954!*
Now, it’s worth noting Stock Advisor’s total average return is 937% — a market-crushing outperformance compared to 214% for the S&P 500. Don't miss the latest top 10 list, available with Stock Advisor, and join an investing community built by individual investors for individual investors.
See the 10 stocks »
*Stock Advisor returns as of September 27, 2026.
Charles Schwab is an advertising partner of Motley Fool Money. Jennifer Saibil has no position in any of the stocks mentioned. The Motley Fool recommends Charles Schwab and recommends the following options: short September 2026 $95 calls on Charles Schwab. The Motley Fool has a disclosure policy.
Recommended Articles


