

Dogecoin Price Forecast: DOGE stuck in bearish trend after new lows

Source Fxstreet
  • Dogecoin remains under pressure on Wednesday, after hitting a new yearly low of $0.055 last week.
  • Weakening derivatives metrics and bearish on-chain data cap DOGE’s recovery.
  • The technical outlook shows bearish momentum remains dominant, despite the risk of short‑term corrective bounces.

Dogecoin (DOGE) remains under pressure, trading around $0.059 on Wednesday, struggling to recover from last week’s sharp sell-off that pushed the meme coin to a new yearly low of $0.055. Weakening derivatives activity and bearish on-chain metrics continue to weigh on market sentiment. In addition, technical indicators suggest sellers remain firmly in control, leaving DOGE vulnerable to further downside.

Weakening derivatives metrics cap the meme coin

Derivatives data shows a bearish bias for Dogecoin. CoinGlass’ long-to-short ratio for DOGE reads 0.90 on Wednesday, nearing the lowest level over a month. A ratio below one indicates bearish sentiment, as traders bet that asset prices will fall.
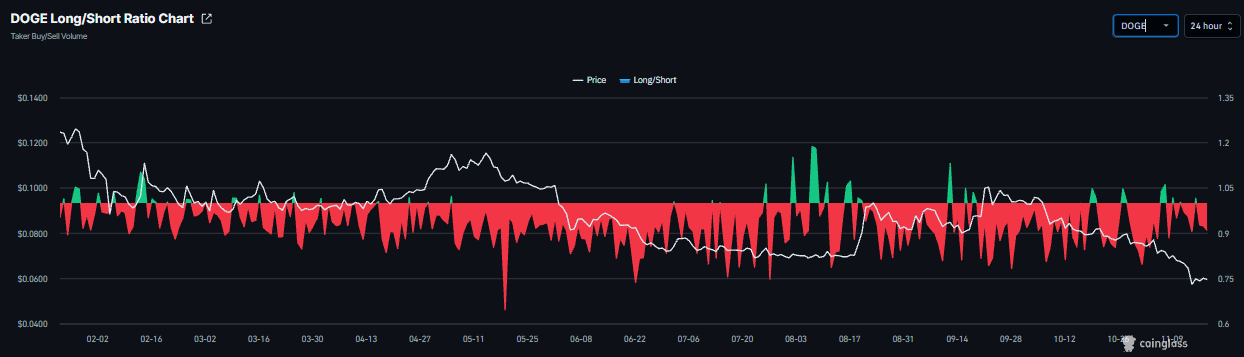
DOGE long-to-short ratio chart. Source: Coinglass

In addition, the meme coin’s funding rate flipped negative on Monday and reads -0.0011% on Wednesday, indicating shorts are paying longs and suggesting a bearish outlook.
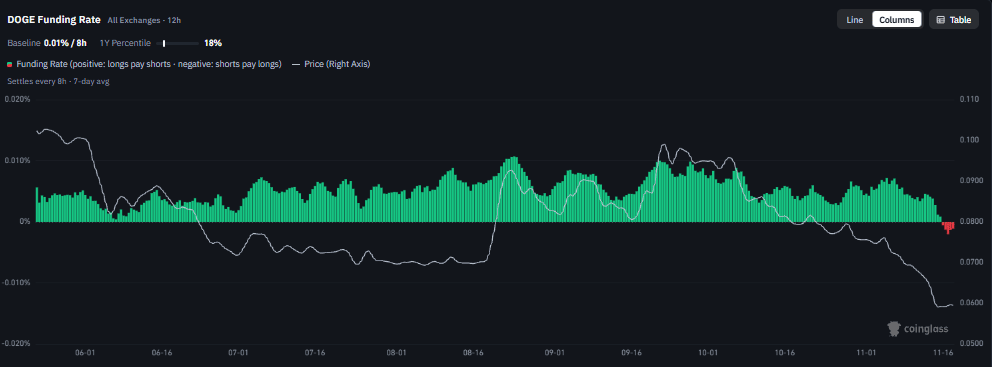
Dogecoin funding rates chart. Source: Coinglass

On-chain data shows cautious outlook

CryptoQuant’s summary data shows a bearish outlook for the dog-themed meme coin. DOGE’s spot and futures markets show large whale orders alongside heating conditions. Both markets also show sell-side dominance. These highlight a bearish, cautious sentiment bias among DOGE meme coin traders.
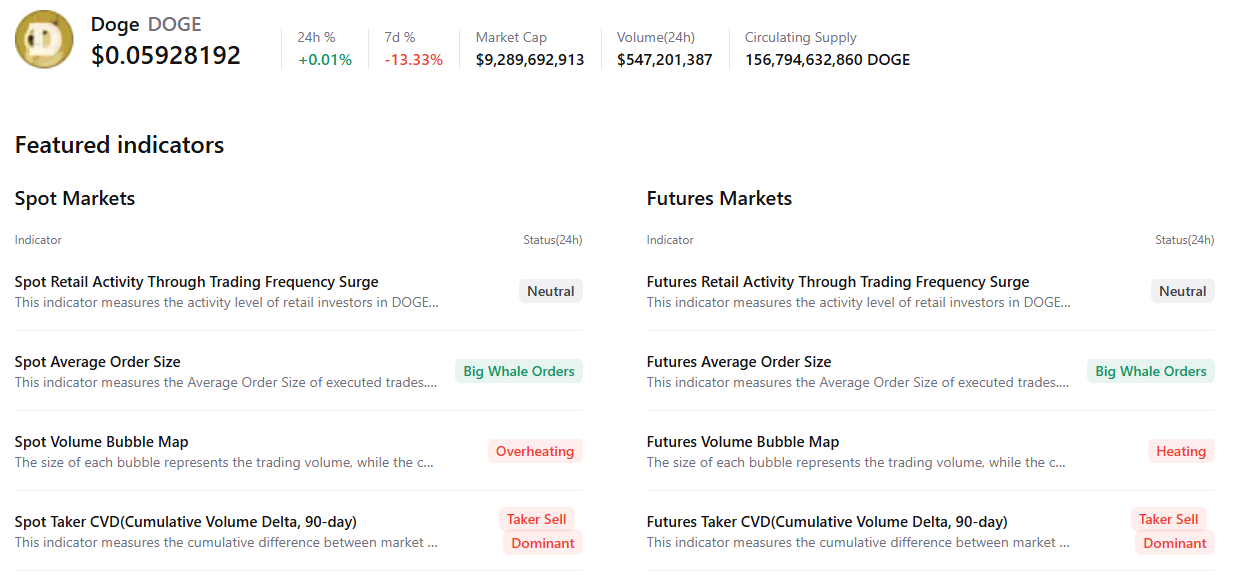
DOGE summary chart. Source: CryptoQuant

Dogecoin technical outlook: Bears maintain control despite potential short-term recovery bounces

Dogecoin price trades at $0.059 on Wednesday after dropping to a new yearly low of $0.055 last week. DOGE remains entrenched in a bearish near‑term bias, with price holding well below the 50‑day, 100‑day, and 200‑day Exponential Moving Averages (EMAs) at roughly $0.074, $0.078, and $0.086. A series of descending resistance trend lines from prior highs, together with the broken upward support line originating around $0.069, now reinforce overhead supply.

The Relative Strength Index (RSI) at about 28 sits in oversold territory. At the same time, the Moving Average Convergence Divergence (MACD) indicator stays negative, hinting that bearish momentum is still dominant despite the risk of short‑term corrective bounces.

On the topside, initial resistance is seen at the horizontal cap near $0.068, closely aligned with the previously supportive rising trendline around $0.069. Above that, the 50‑day EMA at $0.074 and the 100‑day EMA at $0.078 form a secondary barrier, ahead of denser resistance at the 200‑day EMA around $0.086 and a horizontal level near $0.088. Stronger supply is likely to emerge closer to $0.102, where a horizontal line coincides with the broader descending trend structure. With no clear nearby structural floors below, any fresh lows would leave DOGE vulnerable to further downside extension until new demand emerges.
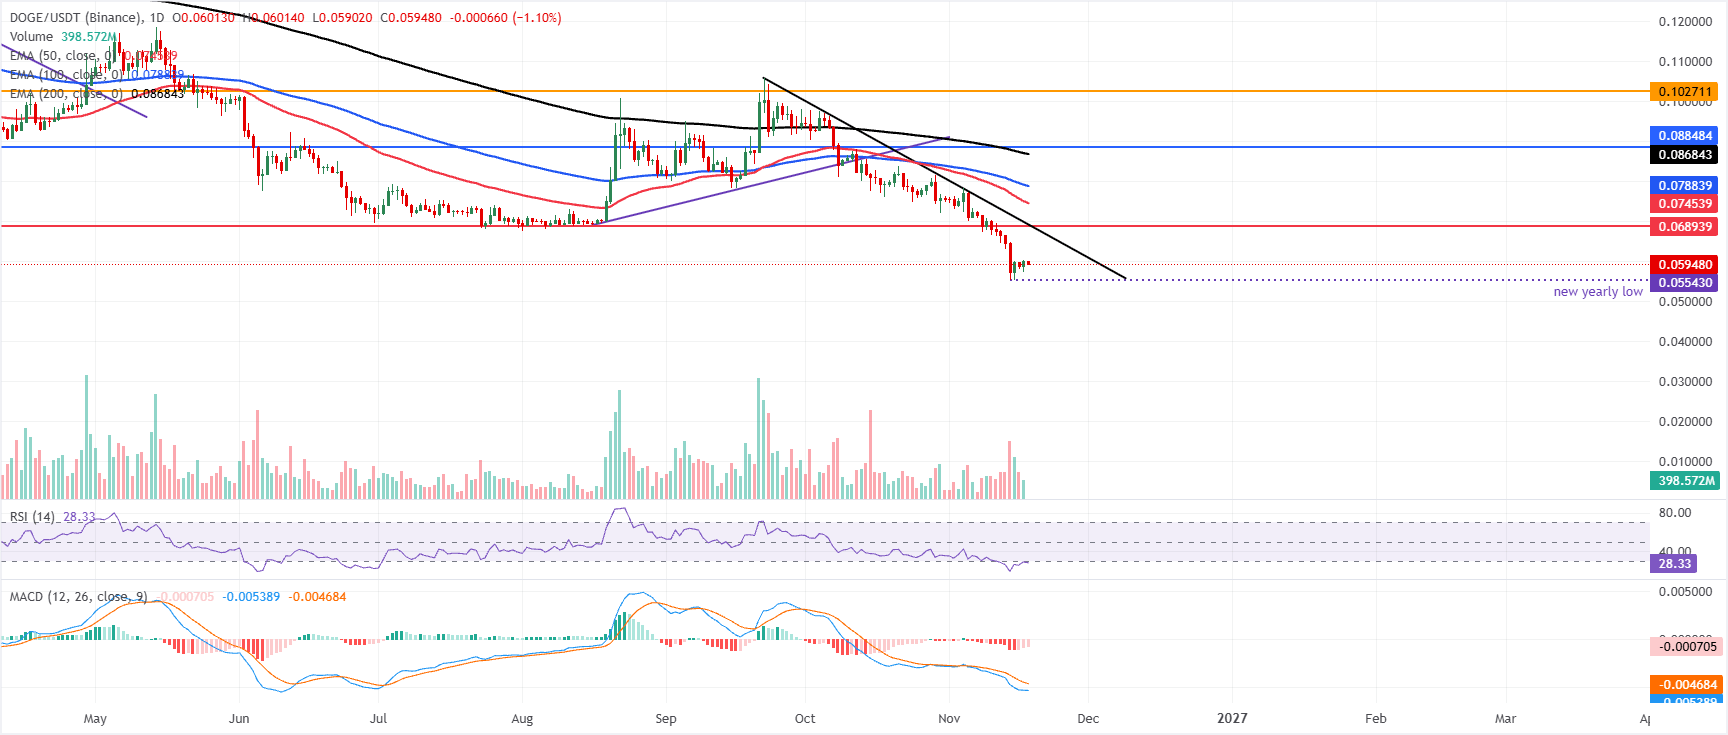
DOGE/USDT daily chart

(The technical analysis of this story was written with the help of an AI tool. Know more.)

Disclaimer: For information purposes only. Past performance is not indicative of future results.
placeholder
Anthropic is six times oversubscribed at $1.4 trillion while Nvidia is down 32% — the AI trade has two pricesAnthropic lists on Nasdaq as ANT on Thursday at $70 ~ $78 a share, raising up to $64.4 billion at a target valuation near $1.4 trillion, and the book is reportedly six times covered. In the same six weeks, Nvidia has fallen 32% and the QQQ is 10.9% below its October peak. Private capital and public markets are marking the same AI complex at two very different prices. This piece separates the two books: what the S-1 shows, who is anchoring the $26 billion private placement, and what Thursday's debut would have to do to change the public tape.
Author  Irene Q.
Nov 16, Mon
Anthropic lists on Nasdaq as ANT on Thursday at $70 ~ $78 a share, raising up to $64.4 billion at a target valuation near $1.4 trillion, and the book is reportedly six times covered. In the same six weeks, Nvidia has fallen 32% and the QQQ is 10.9% below its October peak. Private capital and public markets are marking the same AI complex at two very different prices. This piece separates the two books: what the S-1 shows, who is anchoring the $26 billion private placement, and what Thursday's debut would have to do to change the public tape.
placeholder
Gold Price Analysis Today | Forex Gold Analysis | XAU/USD Analysis - November 16, 2026Get the latest gold price analysis, forex gold insights, and XAU/USD analysis for November 16, 2026. Read on for the details.
Author  Mitrade
Nov 16, Mon
Get the latest gold price analysis, forex gold insights, and XAU/USD analysis for November 16, 2026. Read on for the details.
placeholder
Weekly Report: DXY 103.41, 10-year 5.15%, AUD carry 3bp — three FX regimes flipped in one weekThe dollar index rose 1.09% to 103.41, a 19-month high, while the US 10-year closed at 5.154% and the Australia-US two-year spread collapsed to about 3 basis points from 36. EURUSD fell 1.59% to 1.1024, USDJPY rose 1.51% to 159.78 and AUDUSD fell 1.79% to 0.6764, a 10-month low. Three FX regimes — the broad dollar, the US rate level and the Australian carry premium — flipped in the same week. This report marks the thresholds, ranks which one can flip back first, and lists the week's calendar.
Author  Irene Q.
Nov 16, Mon
The dollar index rose 1.09% to 103.41, a 19-month high, while the US 10-year closed at 5.154% and the Australia-US two-year spread collapsed to about 3 basis points from 36. EURUSD fell 1.59% to 1.1024, USDJPY rose 1.51% to 159.78 and AUDUSD fell 1.79% to 0.6764, a 10-month low. Three FX regimes — the broad dollar, the US rate level and the Australian carry premium — flipped in the same week. This report marks the thresholds, ranks which one can flip back first, and lists the week's calendar.
placeholder
Gold Price Analysis Today | Forex Gold Analysis | XAU/USD Analysis - November 17, 2026Get the latest gold price analysis, forex gold insights, and XAU/USD analysis for November 17, 2026. Read on for the details.
Author  Mitrade
23 hours ago
Get the latest gold price analysis, forex gold insights, and XAU/USD analysis for November 17, 2026. Read on for the details.
placeholder
Gold Price Analysis Today | Forex Gold Analysis | XAU/USD Analysis - November 18, 2026Get the latest gold price analysis, forex gold insights, and XAU/USD analysis for November 18, 2026. Read on for the details.
Author  Mitrade
1 hour ago
Get the latest gold price analysis, forex gold insights, and XAU/USD analysis for November 18, 2026. Read on for the details.
Related Instrument
goTop
quote