

Pi Network Price Forecast: PI tests long-term resistance breakout as selling pressure wanes

Source Fxstreet
  • Pi Network edges higher on Monday, testing the bullish breakout of a long-term resistance trendline.
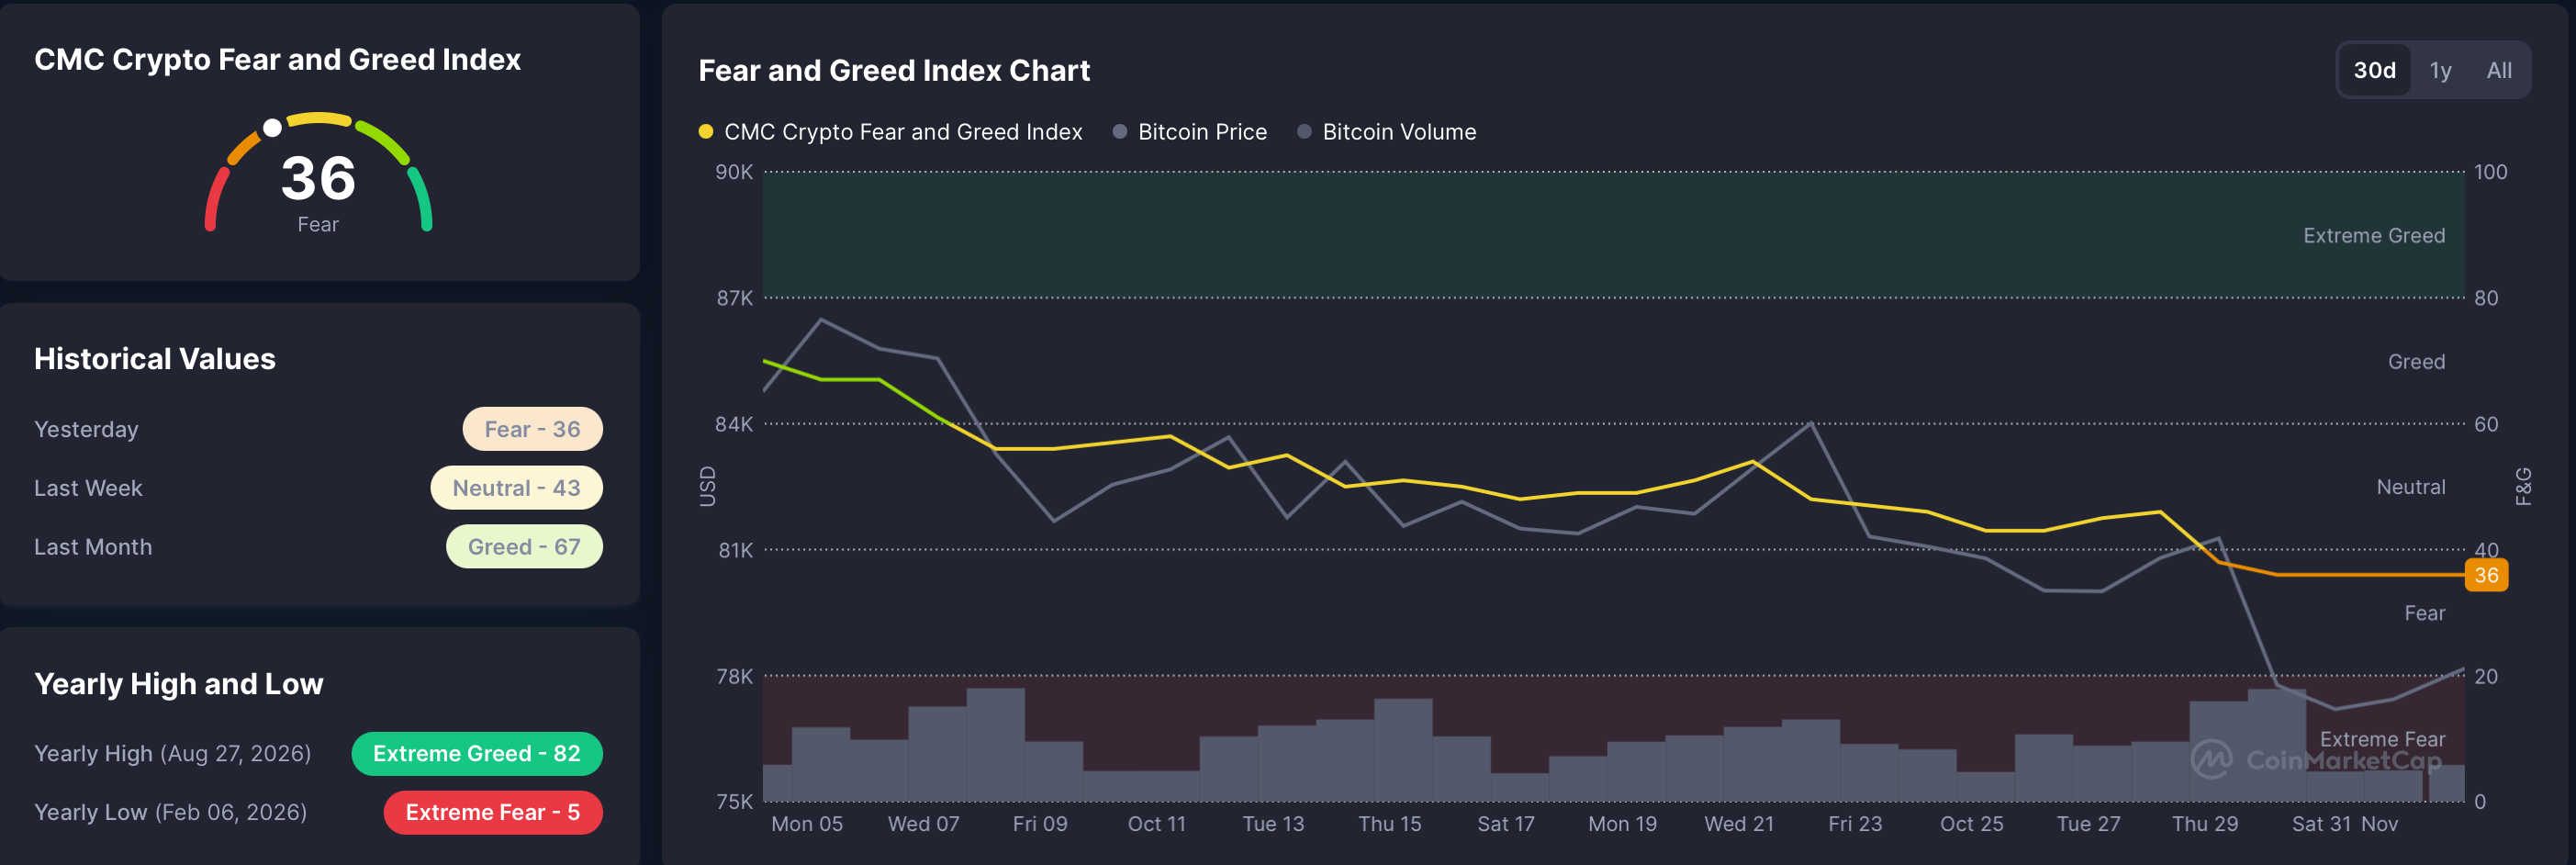
  • Fear and Greed Index declines to 36 from 43 last week, indicating reduced risk appetite.
  • The technical outlook for the PI token indicates a mild upside bias as momentum recovers.

Pi Network (PI) is trading in the green on Monday, testing the bullish breakout of a long-term resistance trendline around $0.0788. Broader market sentiment is under bearish pressure, weighing on altcoins’ demand, with the Fear and Greed Index down to 36 on Monday from 43 last week. The technical outlook for the PI token indicates a mild upside bias as momentum gains strength.

Pi Network gains retail strength despite weak broader market sentiment

Pi Network derivatives show signs of renewed trader interest, with fresh positions building up, despite weak broader market demand. Blockworks data shows the PI futures Open Interest (OI) is at $8.55 million, up from $7.91 million last week, indicating increased notional value of active contracts. The rise in PI futures OI reflects traders' anticipation of further upside in the spot price, potentially leading to a breakout rally.

On the other hand, CoinMarketCap’s Fear and Greed Index is at 36 in the “Fear” zone, suggesting weak investor sentiment following the recent Binance hack, which stole $6 billion and briefly pushed Bitcoin (BTC) below $77,000 last week.
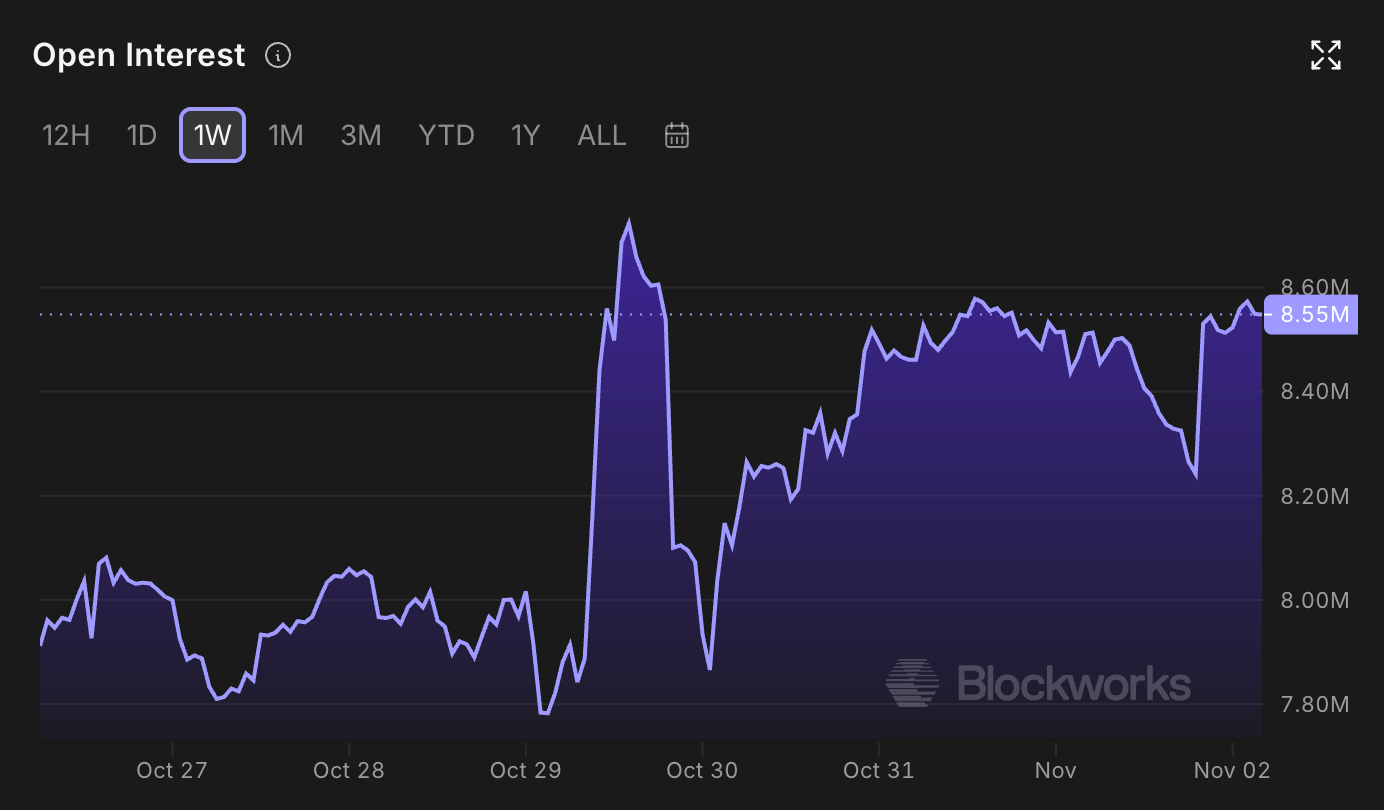
PI token Open Interest chart. Source: Blockworks
Fear and Greed Index. Source: CoinMarketCap

Technical outlook: Will PI token start a breakout rally?

Pi Network trades at $0.0784 at press time, capped beneath a long-term resistance trendline, connecting the June 20 and September 30 highs, around $0.0788. PI also trades below both the 50-day Exponential Moving Averages (EMAs) at $0.0828 and $0.1114, respectively.

Momentum shows signs of recovery on the daily chart, with the Moving Average Convergence Divergence (MACD) crossing above its signal line in negative territory, while the Relative Strength Index (RSI) at 45 rises from the oversold boundary toward the neutral midline.

A confirmed breakout above the resistance trendline at $0.0788 could confirm a bullish trend reversal, potentially targeting the 50-day EMA at $0.0828 and the 50% retracement level of the downswing from $0.1394 to $0.0704, at $0.1049.

Chart Analysis PI/USD (baha Crypto)
PI/USD daily price chart.

Looking down, the only notable structural support is around the October 15 low at $0.0740, followed by the Fibonacci anchor near $0.0704, where buyers would be expected to defend the lower end of the current range if selling pressure resumes.

(The technical analysis of this story was written with the help of an AI tool. Know more.)

Disclaimer: For information purposes only. Past performance is not indicative of future results.
placeholder
Gold Price Analysis Today | Forex Gold Analysis | XAU/USD Analysis - October 30, 2026Get the latest gold price analysis, forex gold insights, and XAU/USD analysis for October 30, 2026. Read on for the details.
Author  Mitrade
Oct 30, Fri
Get the latest gold price analysis, forex gold insights, and XAU/USD analysis for October 30, 2026. Read on for the details.
placeholder
Today’s Market Recap: Three Major US Indexes Plunge, Philadelphia Semiconductor Index Tumbles Over 7%, Oil Falls, Gold and Silver AdvanceWith the U.S. midterm elections approaching, the three major U.S. stock indices and the Philadelphia Semiconductor Index collectively suffered sharp falls last Frida
Author  TradingKey
7 hours ago
With the U.S. midterm elections approaching, the three major U.S. stock indices and the Philadelphia Semiconductor Index collectively suffered sharp falls last Frida
placeholder
Gold Price Analysis Today | Forex Gold Analysis | XAU/USD Analysis - November 2, 2026Get the latest gold price analysis, forex gold insights, and XAU/USD analysis for November 2, 2026. Read on for the details.
Author  Mitrade
6 hours ago
Get the latest gold price analysis, forex gold insights, and XAU/USD analysis for November 2, 2026. Read on for the details.
placeholder
Binance replaced 95% of a $6.3bn hole — Bitcoin is trading the plumbing, not the coinBinance resumed withdrawals on November 1 after a record $6.3bn theft. In the first 9.5 hours, users withdrew $4.64bn and deposited $1.01bn, a net outflow of $3.64bn, or 2.1% of assets. Bitcoin fell to 76,173 and is now 78,473. The market is pricing the exchange, not the supply.
Author  Suzie
6 hours ago
Binance resumed withdrawals on November 1 after a record $6.3bn theft. In the first 9.5 hours, users withdrew $4.64bn and deposited $1.01bn, a net outflow of $3.64bn, or 2.1% of assets. Bitcoin fell to 76,173 and is now 78,473. The market is pricing the exchange, not the supply.
placeholder
Brent slips to $111 as a two-day Hormuz plan lands — the supply-risk premium is the only thing being soldBrent fell 1.95% to $111.20 and WTI to $101.92 after Iran's foreign minister said a Qatar-brokered plan could reopen the Strait of Hormuz in two days. Two tankers were still reported hit by mines. The move is a premium unwind, not a supply change.
Author  Irene Q.
5 hours ago
Brent fell 1.95% to $111.20 and WTI to $101.92 after Iran's foreign minister said a Qatar-brokered plan could reopen the Strait of Hormuz in two days. Two tankers were still reported hit by mines. The move is a premium unwind, not a supply change.
goTop
quote