


Bitcoin Price Forecast: BTC shrugs off “Black Monday” fears, eyes rebound toward $85,000
- Bitcoin extends gains above $82,500 on Monday, testing a bullish breakout of a near-term resistance trendline around $82,479.
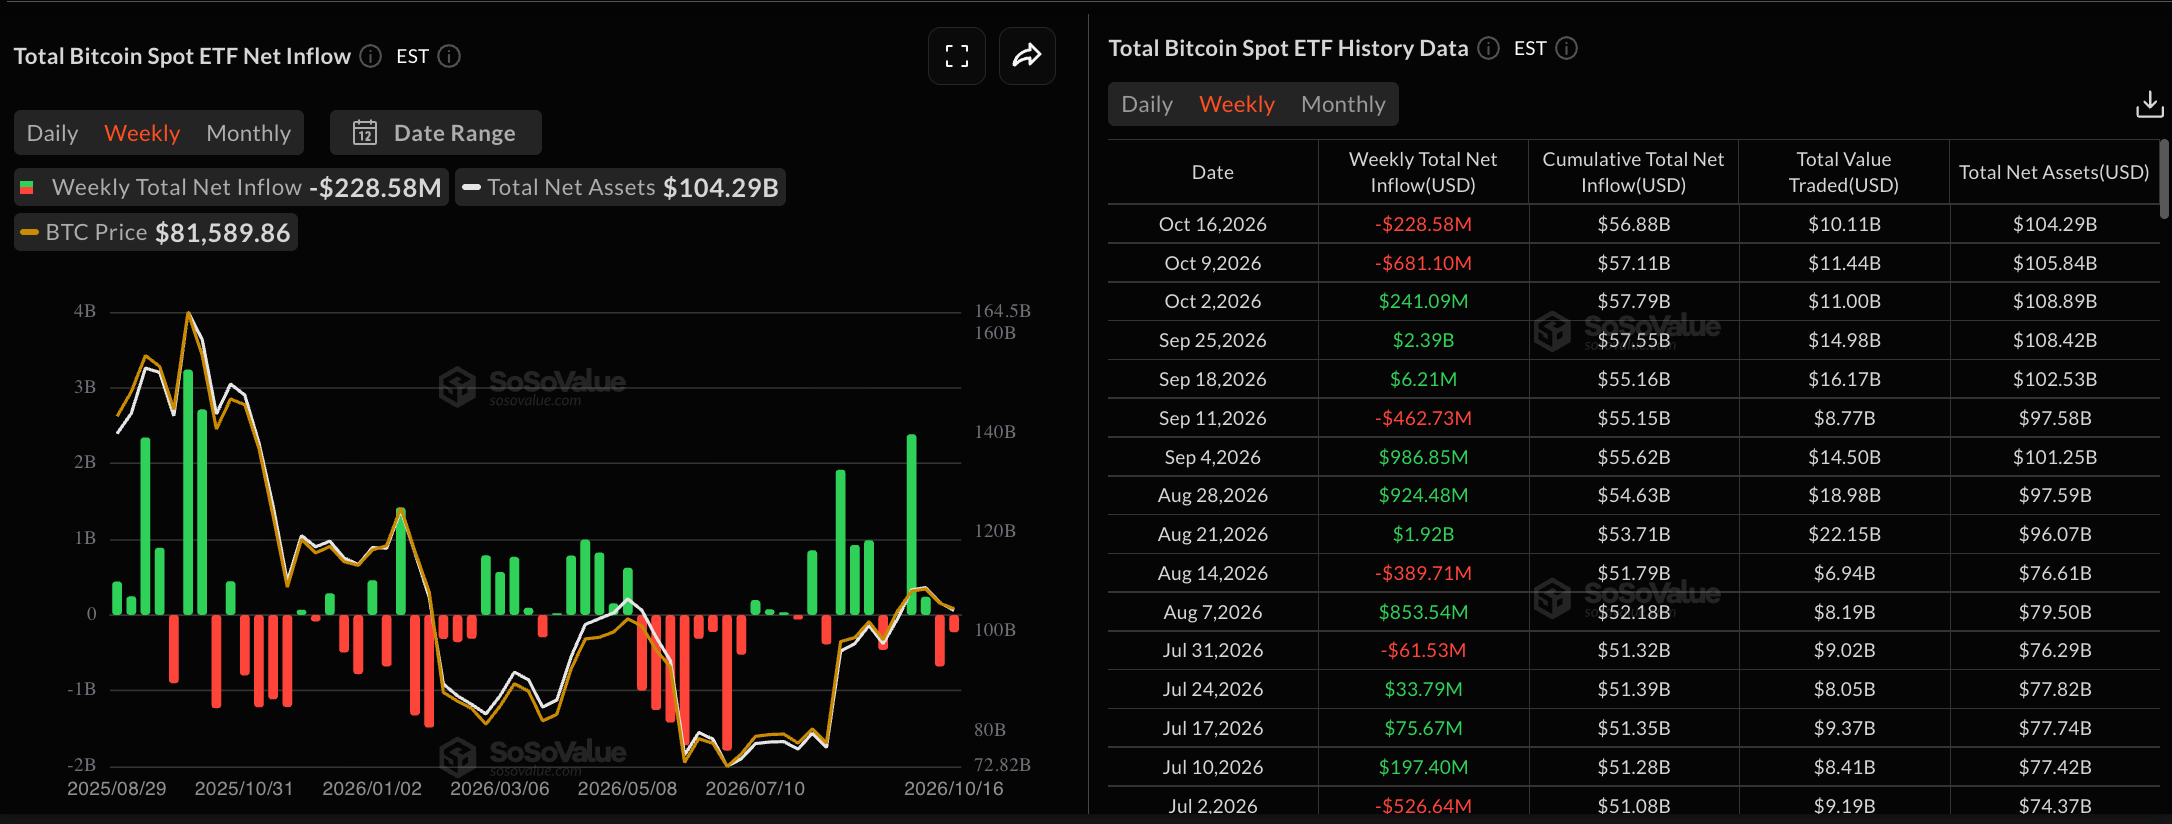
- US-listed spot Bitcoin ETFs recorded net outflows for a second consecutive week, with more than $220 million withdrawn last week.
- Market sentiment remains mixed amid AI-related debt concerns, US inflation worries and geopolitical tensions, while rising oil prices add to market uncertainty.
- The technical outlook for BTC is turning constructive, with near-term upside momentum recovering and buyers eyeing the $84,199 horizontal resistance.
Bitcoin (BTC) price is trading in the green above $82,500 on Monday, extending the mild rebound gains from the previous day. The King Crypto faces reduced institutional confidence, with over $220 million in outflows from BTC spot Exchanged Traded Funds (ETFs)last week, while fears of AI-related debt, US inflation concerns, geopolitical tensions, and rising oil prices weigh on broader market sentiment. Bitcoin must clear $84,199 to sustain a recovery toward September’s high of $87,395.
Bitcoin and US markets shrug off “Black Monday” jitters
Market jitters surfaced at the start of the week, with concerns over a potential decline across major US stocks and cryptocurrencies as investors marked the 39th anniversary of Black Monday, the October 19, 1987, stock market crash. The nervousness was compounded by renewed US inflation concerns. The hotter-than-expected US Consumer Price Index (CPI) and Producer Price Index (PPI) reports for September, released last week, suggest that both consumers and manufacturers are facing higher prices.
Adding to inflation concerns, Brent Oil price surged more than 3% on Friday, climbing above $107 to its highest level since May, amid geopolitical tensions and concerns over supply disruptions.
Persistent inflation in the US and elevated energy prices have revived concerns about a potential interest rate hike by the US Federal Reserve (Fed) to tame inflation, which could eventually weigh on risk-sensitive assets such as Bitcoin.
Completing the trifecta, concerns over debt-fueled AI infrastructure spending intensified after CoreWeave shares plunged nearly 25% last week. The cloud computing company relies heavily on debt to finance data centers leased to AI and technology firms, raising questions about the sustainability of AI-related investments, as FXStreet previously reported.
Still, the crypto and US stock markets are edging higher, shrugging off the “Black Monday” fears, with Bitcoin holding above $82,000 and NASDAQ up over 1% at the time of writing.
Retail speculation holds amid Bitcoin ETF outflows
US-listed BTC spot ETFs have experienced persistent selling pressure over the last two weeks, indicating heavy investor redemptions. SoSoValue data shows that BTC ETFs recorded $228.58 million in outflows last week, following $681.10 million previously, suggesting a mild easing of ongoing selling pressure. Typically, consecutive weekly ETFs outflows weigh on Bitcoin and dampen investor demand.
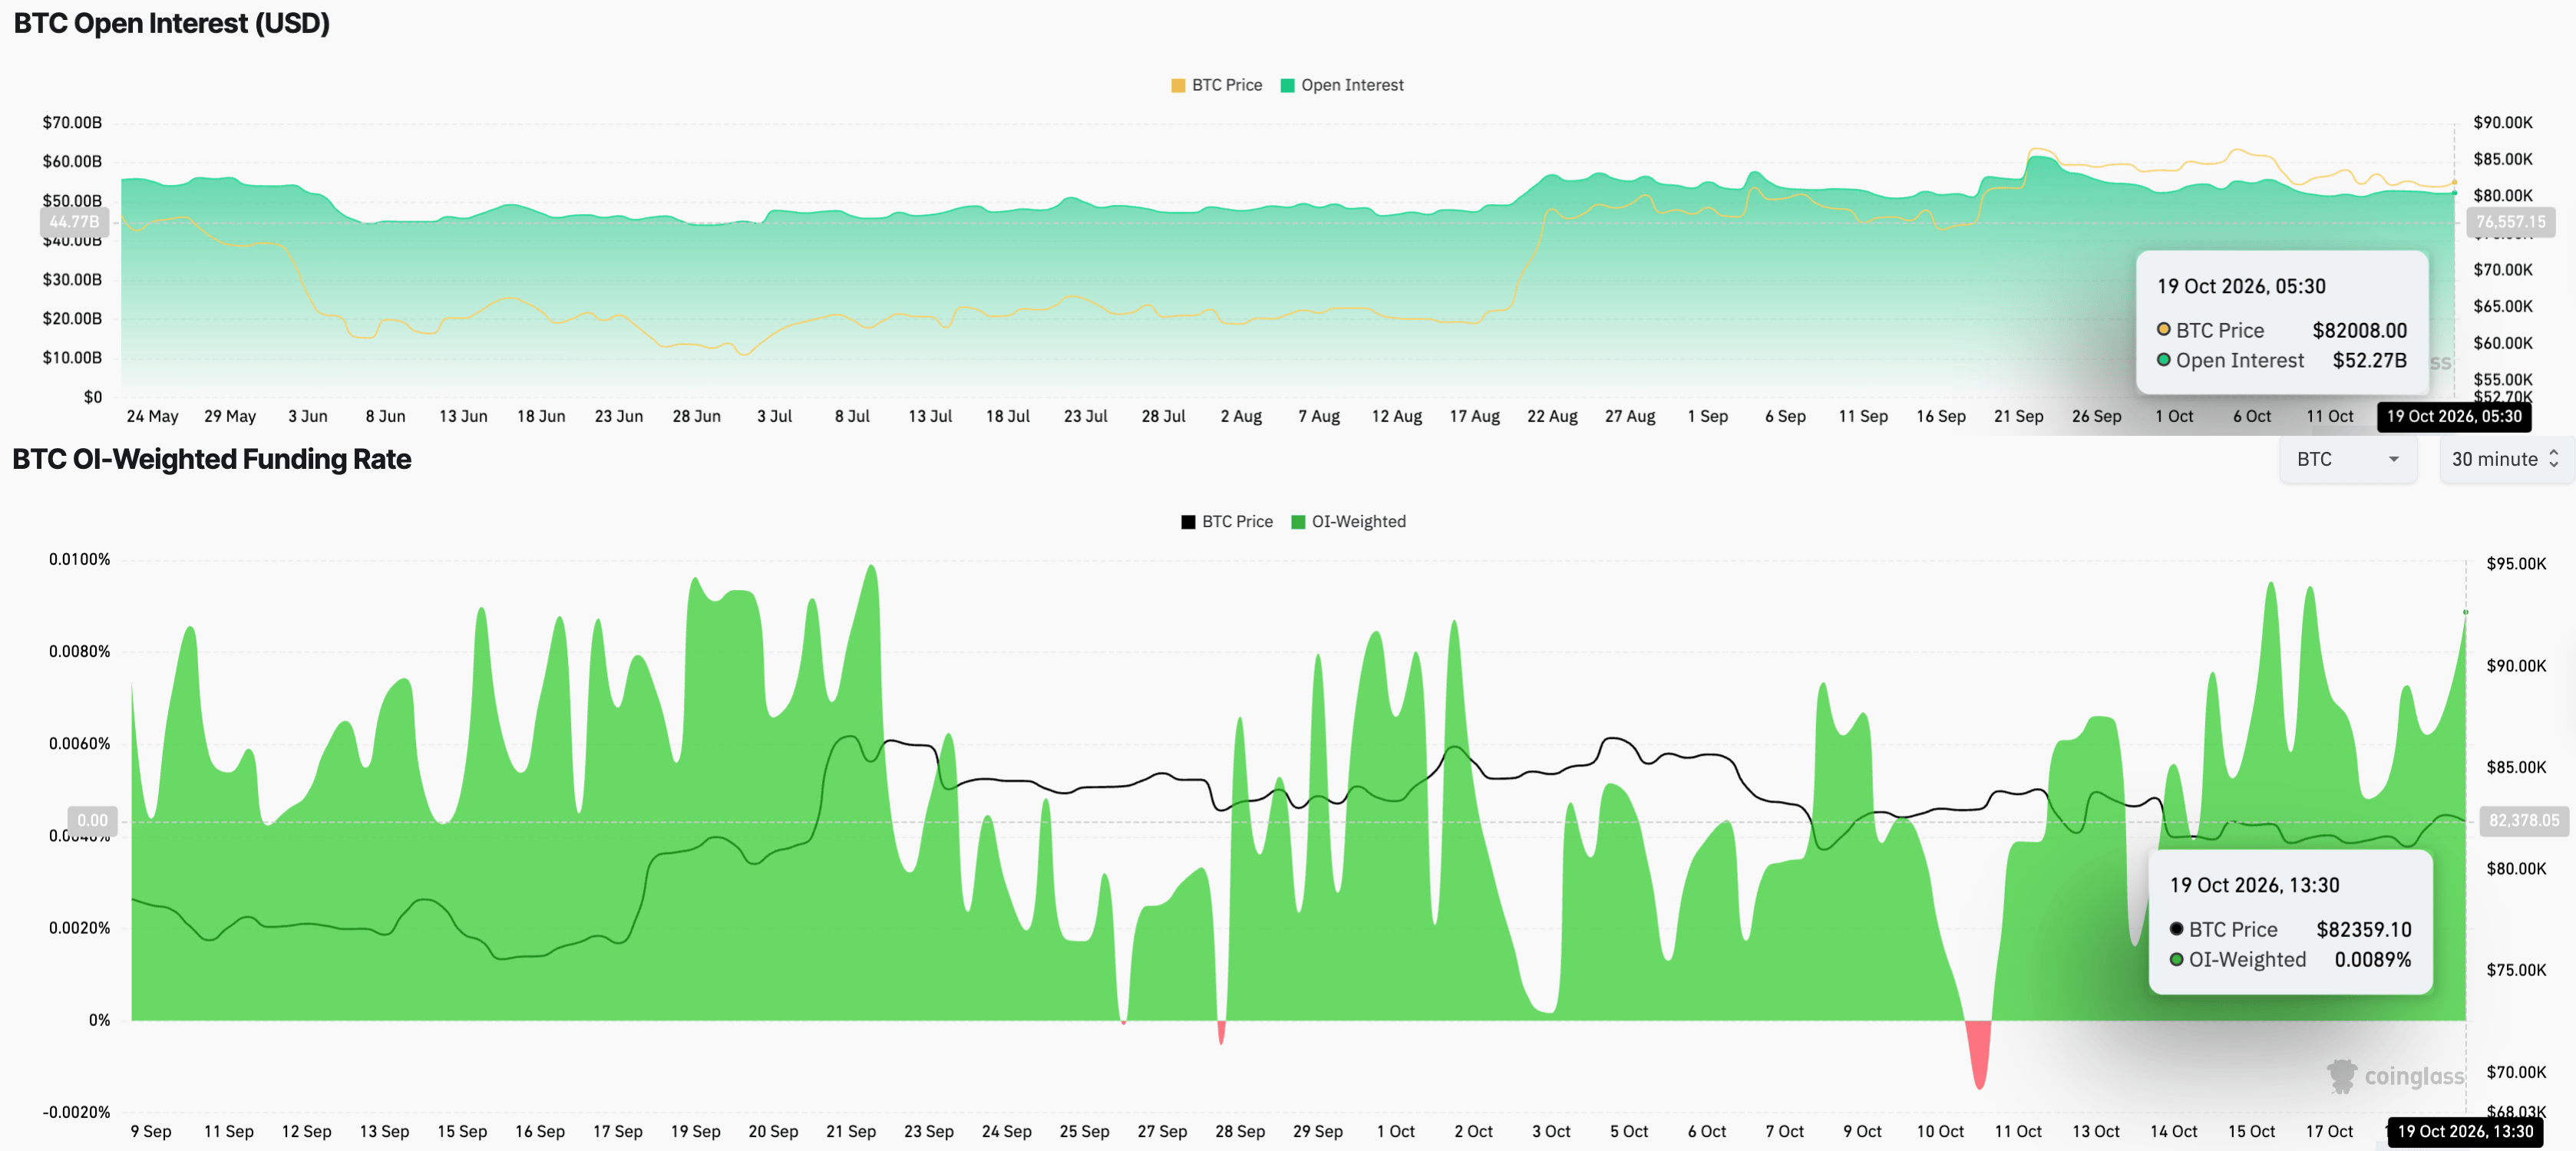
However, retail interest in Bitcoin remains steady despite the outflows in ETFs. CoinGlass data shows BTC Open Interest (OI) at $52.27 billion on Monday, up marginally from $51.88 billion last week, reflecting a largely stable notional value of all active Bitcoin perpetual contracts. Meanwhile, an upsurge in the funding rate to 0.0089% from 0.0062% the previous day suggests that traders are more likely to take long positions.
Technical outlook: Will BTC price sustain its upside momentum?
Bitcoin trades at $82,560 at press time on Monday, holding a broadly constructive bullish bias. On the 4-hour chart, BTC price reclaims both the 50-period and 200-period Exponential Moving Averages (EMAs) at $82,336 and $81,948, respectively, reducing the risk of a Death Cross between them.
From a technical perspective, the rebound in BTC tests the bullish breakout of a descending resistance trendline, connecting the October 6 and 14 highs, around $82,479. A confirmed breakout above this level could reinforce a short-term bullish structure and open the path toward the October 11 high at $84,199.
The Moving Average Convergence Divergence (MACD) moves into positive territory on the 4-hour chart, with its histogram expanding above the zero line. At the same time, the Relative Strength Index (RSI) at 54 hovers above the midline, hinting that upside momentum remains mildly in favor of buyers.
On the downside, initial support is seen at the 50- and 200-period EMAs around $82,336 and $81,948, which together define the first demand cluster if the pair pulls back. A deeper retreat would expose the September 20 low at $80,126 as the next key floor, where failure to hold would weaken the current bullish tone and open the door to a broader consolidation phase.
(The technical analysis of this story was written with the help of an AI tool. Know more.)
Recommended Articles


