

Zcash Price Forecast: ZEC poses 20% downside risk amid steady ETF outflows

Source Fxstreet
  • Zcash is down 6% so far on Thursday, extending a 2% decline from the previous day.
  • Grayscale’s ZEC-focused ETF recorded $8.49 million in outflows on Wednesday, totaling over $12 million so far this week.
  • The technical outlook for ZEC indicates a downside bias, with near-term momentum shifting bearish.

Zcash (ZEC) price is trading below $1,300 on Thursday, continuing a steady decline over the past 10 days and slipping from its $1,698 peak on September 27. Grayscale’s ZEC Exchange-Traded Fund (ETF) continues to record consistent outflows, with $8.49 million on Wednesday, suggesting reduced demand following the recent stock split. The technical outlook for ZEC is bearish, with bears focused on a break below the 200-period Exponential Moving Average (EMA) on the 4-hour chart around $1,287.

Institutional demand eases after stock split

Grayscale’s Zcash-focused ETF (ZCSH) is experiencing persistent selling pressure, driven by investor redemptions last week following the 3-for-1 stock split. SoSoValue data shows $8.49 million in outflows on Wednesday, bringing the week's total to $12.05 million, up from $93.56 million last week. 

On the other hand, a fresh ZEC-focused ETF filing has been submitted by Cameron and Tyler Winklevoss, 13 years after their Bitcoin ETF filing in 2013. This suggests a long-term constructive outlook for the privacy coin from industry pioneers. Still, the short-term outflows weigh on the spot market, risking further corrective moves.
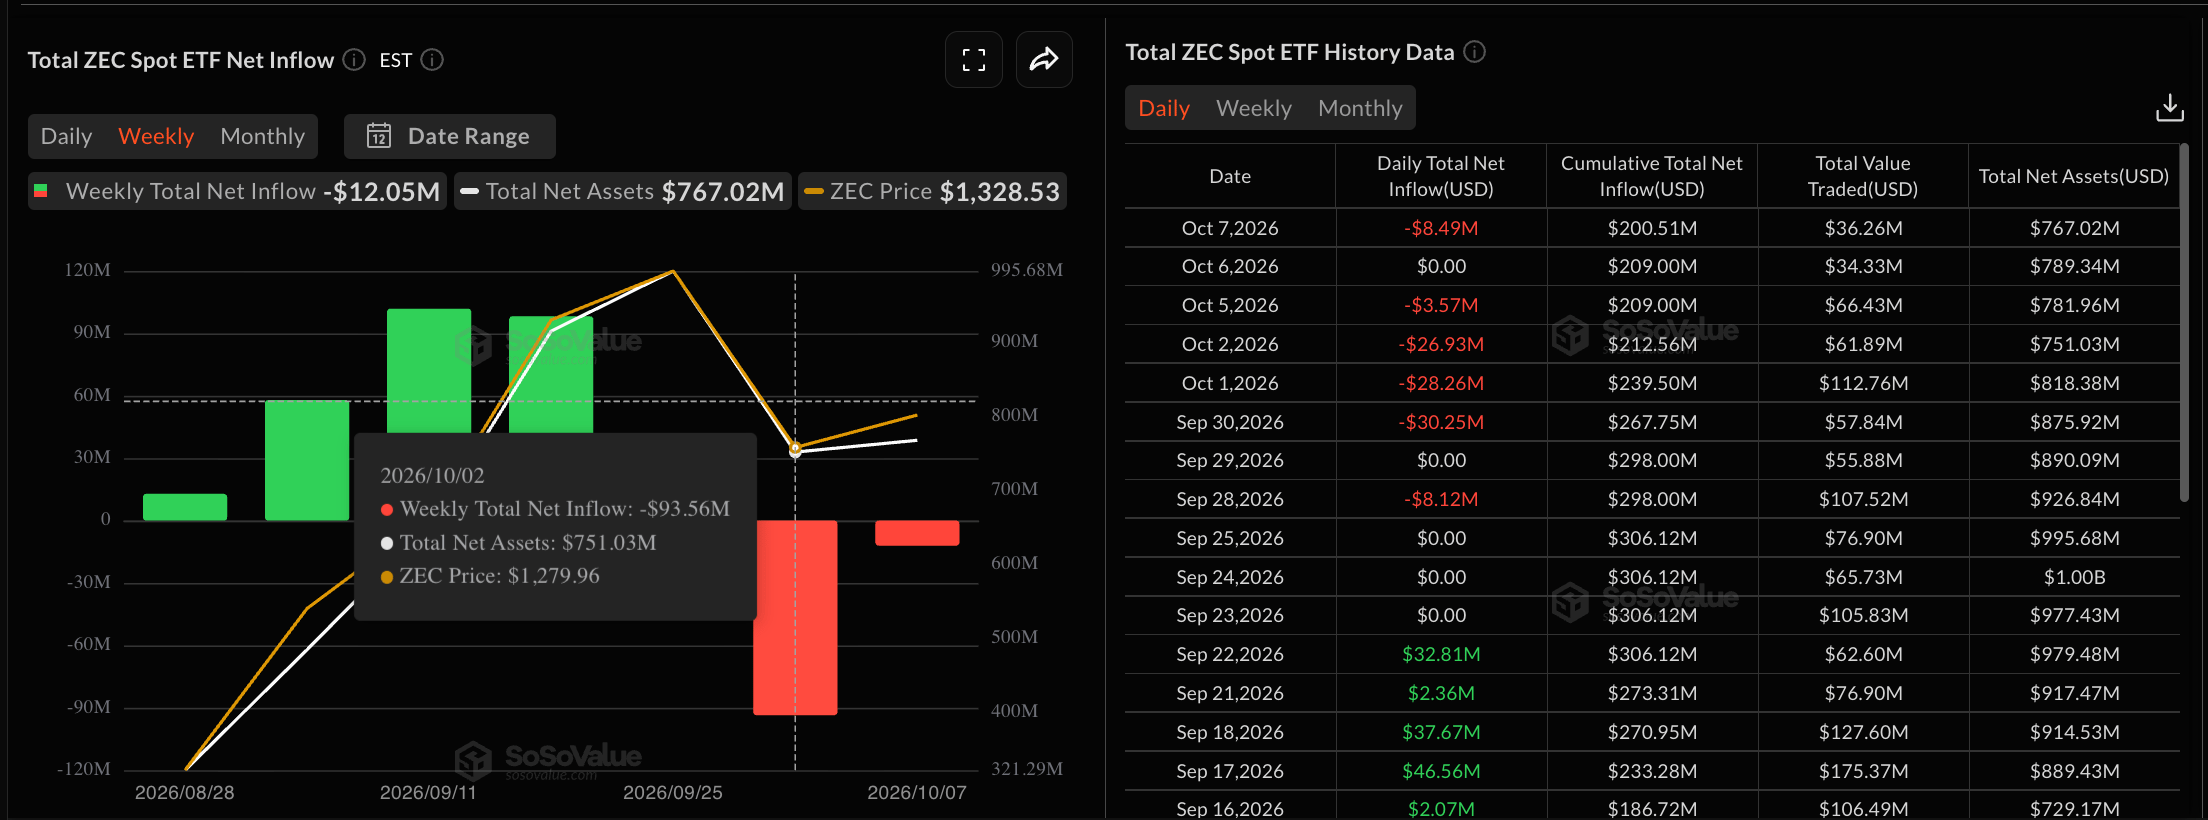

Zcash ETFs data. Source: Sosovalue

https://x.com/JSeyff/status/2107520177739117010

Technical outlook: Zcash risks a drop to $1,050

Zcash trades around $1,246 at press time on Thursday, maintaining a bearish near-term bias. The privacy token is trading below its 200-period EMA at $1,287 on the 4-hour chart, while the declining 50-day EMA risks crossing below the longer-term average, a death cross pattern that would confirm a bearish trend reversal.

Momentum on the 4-hour chart shows a corrective bias, with the Moving Average Convergence Divergence (MACD) crossing below the signal line, while the Relative Strength Index (RSI) near 33 suggests building downside pressure with conditions edging toward oversold rather than a firm base.

From a technical perspective, a decisive sustained breakout below the 200-period EMA at $1,287 could extend the decline toward the $1,050 support level set by the September 4 high. Any deeper pullbacks could risk surpassing the $1,000 psychological support level and testing the $888 horizontal level set by the August 23 high.

Chart Analysis ZEC/USDT (Binance)
ZEC/USDT four-hour price chart.

On the topside, initial resistance is located at the 200-period EMA around $1,287, with a stronger cap at the 50-period EMA near $1,355. Zcash must reclaim these levels to ease the current bearish tone.

(The technical analysis of this story was written with the help of an AI tool. Know more.)

Disclaimer: For information purposes only. Past performance is not indicative of future results.
placeholder
October hike odds climb toward 60% as Goldman and BofA both flip — what Warsh's "dose of accommodation" really changedRate futures now price roughly 55% to 62% for a 25bp hike at the October 27-28 FOMC, up from about 30% before Chair Warsh's post-meeting framing that the Fed is merely "removing some accommodation." Goldman Sachs has added an October hike to its forecast and Bank of America now sees moves in both October and December. Here is the repricing, the language behind it, and the two data points that decide it.
Author  Irene Q.
Sep 23, Wed
Rate futures now price roughly 55% to 62% for a 25bp hike at the October 27-28 FOMC, up from about 30% before Chair Warsh's post-meeting framing that the Fed is merely "removing some accommodation." Goldman Sachs has added an October hike to its forecast and Bank of America now sees moves in both October and December. Here is the repricing, the language behind it, and the two data points that decide it.
placeholder
Gold holds steady below $4,150 amid elevated US yields Gold price (XAU/USD) trades on a flat note near $4,140 during the early Asian session on Tuesday. Pressure from a stronger US Dollar (USD) and elevated US Treasury yields was offset by reduced expectations of a Federal Reserve (Fed) rate hike this month.
Author  FXStreet
Oct 06, Tue
Gold price (XAU/USD) trades on a flat note near $4,140 during the early Asian session on Tuesday. Pressure from a stronger US Dollar (USD) and elevated US Treasury yields was offset by reduced expectations of a Federal Reserve (Fed) rate hike this month.
placeholder
WTI rises to near $89.50 as Middle East supply threats offset Persian Gulf recoveryWest Texas Intermediate (WTI) oil price extends its gains for the second successive day, trading around $89.50 per barrel during the Asian hours on Wednesday. Crude oil climbed as persistent risks to Middle East energy flows overshadowed signs of rising supply from the region.
Author  FXStreet
Yesterday 01: 26
West Texas Intermediate (WTI) oil price extends its gains for the second successive day, trading around $89.50 per barrel during the Asian hours on Wednesday. Crude oil climbed as persistent risks to Middle East energy flows overshadowed signs of rising supply from the region.
placeholder
Gold Price Forecast: XAU/USD retraces gains and nears two-month lows at $4,104Gold (XAU/USD) retraces Tuesday’s gains on Wednesday and resumes its broader bearish trend, with the US Dollar (USD) appreciating across the board, as investors brace for the release of the minutes of the latest Federal Reserve (Fed) meeting.
Author  FXStreet
21 hours ago
Gold (XAU/USD) retraces Tuesday’s gains on Wednesday and resumes its broader bearish trend, with the US Dollar (USD) appreciating across the board, as investors brace for the release of the minutes of the latest Federal Reserve (Fed) meeting.
placeholder
Euro slides to a 17-month low as France's budget crisis spreads — can 1.12 hold?EUR/USD touched 1.1162 on 5 October, its weakest level in 17 months, as France's budget standoff pushed the 10-year OAT above 5% and the OAT-Bund spread to roughly 160bp — the widest since the 2011-12 eurozone debt crisis. The euro now trades near 1.1215 ahead of US jobless claims and a $22 billion 30-year Treasury auction. Here are the levels and the two scenarios to watch.
Author  Irene Q.
55 mins ago
EUR/USD touched 1.1162 on 5 October, its weakest level in 17 months, as France's budget standoff pushed the 10-year OAT above 5% and the OAT-Bund spread to roughly 160bp — the widest since the 2011-12 eurozone debt crisis. The euro now trades near 1.1215 ahead of US jobless claims and a $22 billion 30-year Treasury auction. Here are the levels and the two scenarios to watch.
goTop
quote