

NZD/USD Price Forecast: Drifting closer to 18-month lows at 0.5580

Source Fxstreet
  • NZD/USD turns lower from a 0.5622 high on Wednesday and approaches an 18-month low at 0.5580.
  • High Oil prices amid the escalating tensions in the Middle East have hammered risk appetite on Thursday.
  • The pair is trading at the bottom of the recent range, ready to extend the downtrend from August's highs.

The New Zealand Dollar (NZD) reverses earlier gains as market sentiment sours on Thursday's early European session, and turns negative against the US Dollar (USD) in the daily chart. Higher Oil prices amid escalating tensions in the Middle East are pushing Treasury yields higher and setting a floor on the US Dollar's pullback seen during the Asian trade.

New attacks on Saudi Arabian airports by the Houthis from Yemen, an Iran proxy, have boosted Oil prices, pushing the Brent Crude barrel to levels near $102.00, amid growing concerns about supply constraints if new attacks damage Saudi's Oil sites.

Crude's rally is also boosting Treasury yields amid markets’ conviction that the elevated energy prices will force central bankers to tighten monetary policy. This has offset the mild US Dollar weakness witnessed after the release of September’s Federal Reserve (Fed) meeting, which showed concerns about inflation but did not alter the view that the central bank will stand pat on rates in October.

Technical Analysis: Support at 0.5580 is coming into play
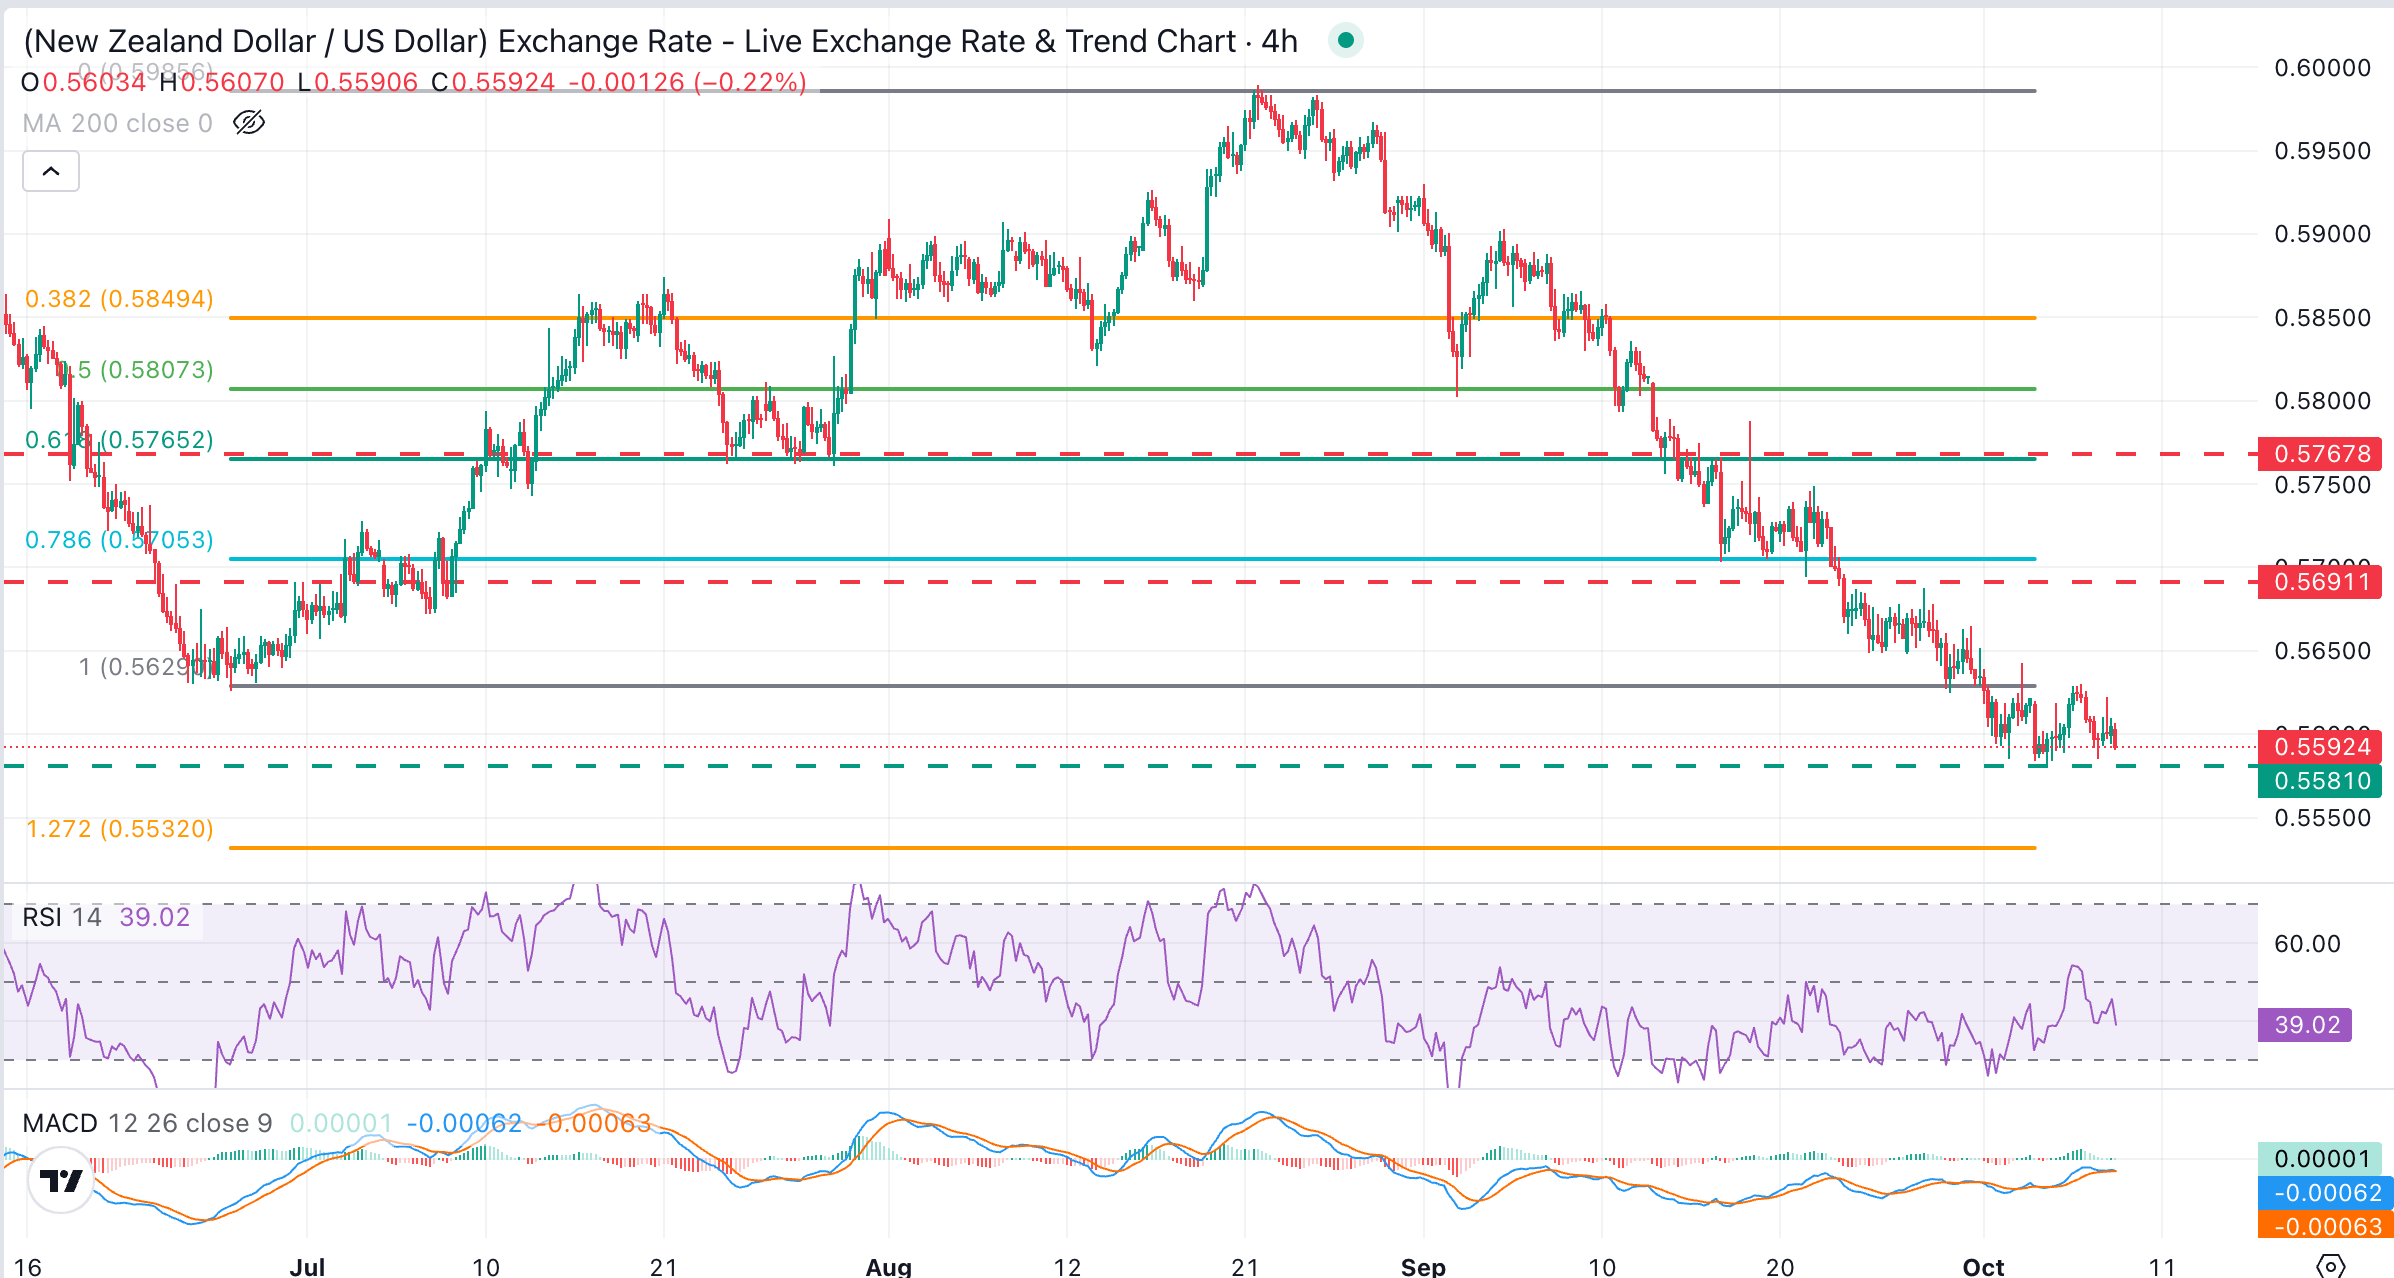
NZD/USD Chart Analysis


NZD/USD trades at 0.5596, with bearish momentum building as the 0.5580 support area comes into focus. Indicators on the 4-hour chart endorse this view, with the Relative Strength Index (14) around 40 and the Moving Average Convergence Divergence (MACD) hovering near zero, altogether leaving the bears with a slight edge.

Bears are focused on Monday's low at the mentioned 0.5580. Below here, the next downside target would be the 127.2% Fibonacci retracement of the June-August rally, at 0.5530, ahead of the 2025 floor, at 0.8490.

On the topside, the late June low in the 0.5630 area is keeping upside attempts capped for now, and closing the path towards the September 28 high near 0.5690 and a support-turned-resistance around the June 23 lows at 0.5765.

(The technical analysis of this story was written with the help of an AI tool. Know more.)

New Zealand Dollar Price Today

The table below shows the percentage change of New Zealand Dollar (NZD) against listed major currencies today. New Zealand Dollar was the strongest against the Australian Dollar.

USD EUR GBP JPY CAD AUD NZD CHF
USD 0.04% 0.10% 0.06% -0.01% 0.26% 0.11% -0.03%
EUR -0.04% 0.06% 0.02% -0.06% 0.15% 0.08% -0.07%
GBP -0.10% -0.06% -0.04% -0.13% 0.08% 0.02% -0.11%
JPY -0.06% -0.02% 0.04% -0.09% 0.13% 0.02% -0.07%
CAD 0.01% 0.06% 0.13% 0.09% 0.22% 0.13% 0.02%
AUD -0.26% -0.15% -0.08% -0.13% -0.22% -0.06% -0.20%
NZD -0.11% -0.08% -0.02% -0.02% -0.13% 0.06% -0.08%
CHF 0.03% 0.07% 0.11% 0.07% -0.02% 0.20% 0.08%

The heat map shows percentage changes of major currencies against each other. The base currency is picked from the left column, while the quote currency is picked from the top row. For example, if you pick the New Zealand Dollar from the left column and move along the horizontal line to the US Dollar, the percentage change displayed in the box will represent NZD (base)/USD (quote).

Disclaimer: For information purposes only. Past performance is not indicative of future results.
placeholder
October hike odds climb toward 60% as Goldman and BofA both flip — what Warsh's "dose of accommodation" really changedRate futures now price roughly 55% to 62% for a 25bp hike at the October 27-28 FOMC, up from about 30% before Chair Warsh's post-meeting framing that the Fed is merely "removing some accommodation." Goldman Sachs has added an October hike to its forecast and Bank of America now sees moves in both October and December. Here is the repricing, the language behind it, and the two data points that decide it.
Author  Irene Q.
Sep 23, Wed
Rate futures now price roughly 55% to 62% for a 25bp hike at the October 27-28 FOMC, up from about 30% before Chair Warsh's post-meeting framing that the Fed is merely "removing some accommodation." Goldman Sachs has added an October hike to its forecast and Bank of America now sees moves in both October and December. Here is the repricing, the language behind it, and the two data points that decide it.
placeholder
Gold holds steady below $4,150 amid elevated US yields Gold price (XAU/USD) trades on a flat note near $4,140 during the early Asian session on Tuesday. Pressure from a stronger US Dollar (USD) and elevated US Treasury yields was offset by reduced expectations of a Federal Reserve (Fed) rate hike this month.
Author  FXStreet
Oct 06, Tue
Gold price (XAU/USD) trades on a flat note near $4,140 during the early Asian session on Tuesday. Pressure from a stronger US Dollar (USD) and elevated US Treasury yields was offset by reduced expectations of a Federal Reserve (Fed) rate hike this month.
placeholder
WTI rises to near $89.50 as Middle East supply threats offset Persian Gulf recoveryWest Texas Intermediate (WTI) oil price extends its gains for the second successive day, trading around $89.50 per barrel during the Asian hours on Wednesday. Crude oil climbed as persistent risks to Middle East energy flows overshadowed signs of rising supply from the region.
Author  FXStreet
Yesterday 01: 26
West Texas Intermediate (WTI) oil price extends its gains for the second successive day, trading around $89.50 per barrel during the Asian hours on Wednesday. Crude oil climbed as persistent risks to Middle East energy flows overshadowed signs of rising supply from the region.
placeholder
Gold Price Forecast: XAU/USD retraces gains and nears two-month lows at $4,104Gold (XAU/USD) retraces Tuesday’s gains on Wednesday and resumes its broader bearish trend, with the US Dollar (USD) appreciating across the board, as investors brace for the release of the minutes of the latest Federal Reserve (Fed) meeting.
Author  FXStreet
22 hours ago
Gold (XAU/USD) retraces Tuesday’s gains on Wednesday and resumes its broader bearish trend, with the US Dollar (USD) appreciating across the board, as investors brace for the release of the minutes of the latest Federal Reserve (Fed) meeting.
placeholder
Euro slides to a 17-month low as France's budget crisis spreads — can 1.12 hold?EUR/USD touched 1.1162 on 5 October, its weakest level in 17 months, as France's budget standoff pushed the 10-year OAT above 5% and the OAT-Bund spread to roughly 160bp — the widest since the 2011-12 eurozone debt crisis. The euro now trades near 1.1215 ahead of US jobless claims and a $22 billion 30-year Treasury auction. Here are the levels and the two scenarios to watch.
Author  Irene Q.
1 hour ago
EUR/USD touched 1.1162 on 5 October, its weakest level in 17 months, as France's budget standoff pushed the 10-year OAT above 5% and the OAT-Bund spread to roughly 160bp — the widest since the 2011-12 eurozone debt crisis. The euro now trades near 1.1215 ahead of US jobless claims and a $22 billion 30-year Treasury auction. Here are the levels and the two scenarios to watch.
Related Instrument
goTop
quote