

Aave Price Forecast: Consolidates below $161 as profit-taking emerges after 10% surge

Source Fxstreet
  • Aave corrects slightly, trading below $161 on Wednesday after surging more than 10% the previous day.
  • Santiment data shows AAVE’s NPL metric spiked on Tuesday, signaling increased profit-taking after the sharp price rally.
  • Stani Kulechov, Aave founder, is considering adding an AAVE token burn mechanism to Aavenomics 3.0.

Aave (AAVE) slips below $161 on Wednesday after surging more than 10% the previous day, with on-chain data suggesting increased profit-taking. Meanwhile, Aave founder Stani Kulechov is considering an AAVE token-burn mechanism under Aavenomics 3.0, adding a potential catalyst for AAVE.

Profit-taking weighs on AAVE

Santiment’s Network Realized Profit/Loss (NPL) metric indicates Aave holders are booking profits following its recent price surge.

As shown in the chart below, the metric spiked sharply on Tuesday, reaching its highest level since early May. This spike indicates that holders are, on average, selling their bags at a significant profit, thereby increasing the selling pressure.

Aave NPL chart. Source: Santiment

Aave founder considers AAVE token burn for Aavenomics 3.0

Despite sharp profit-taking, the market sentiment remains bullish for AAVE. Aave founder Stani Kulechov said on Monday that he is considering adding an AAVE token-burn mechanism to Aavenomics 3.0, building on the protocol’s existing revenue-funded buyback program launched in 2025. This proposal could further strengthen AAVE’s tokenomics by reducing the circulating supply alongside the existing buyback mechanism, supporting the bullish long-term outlook.

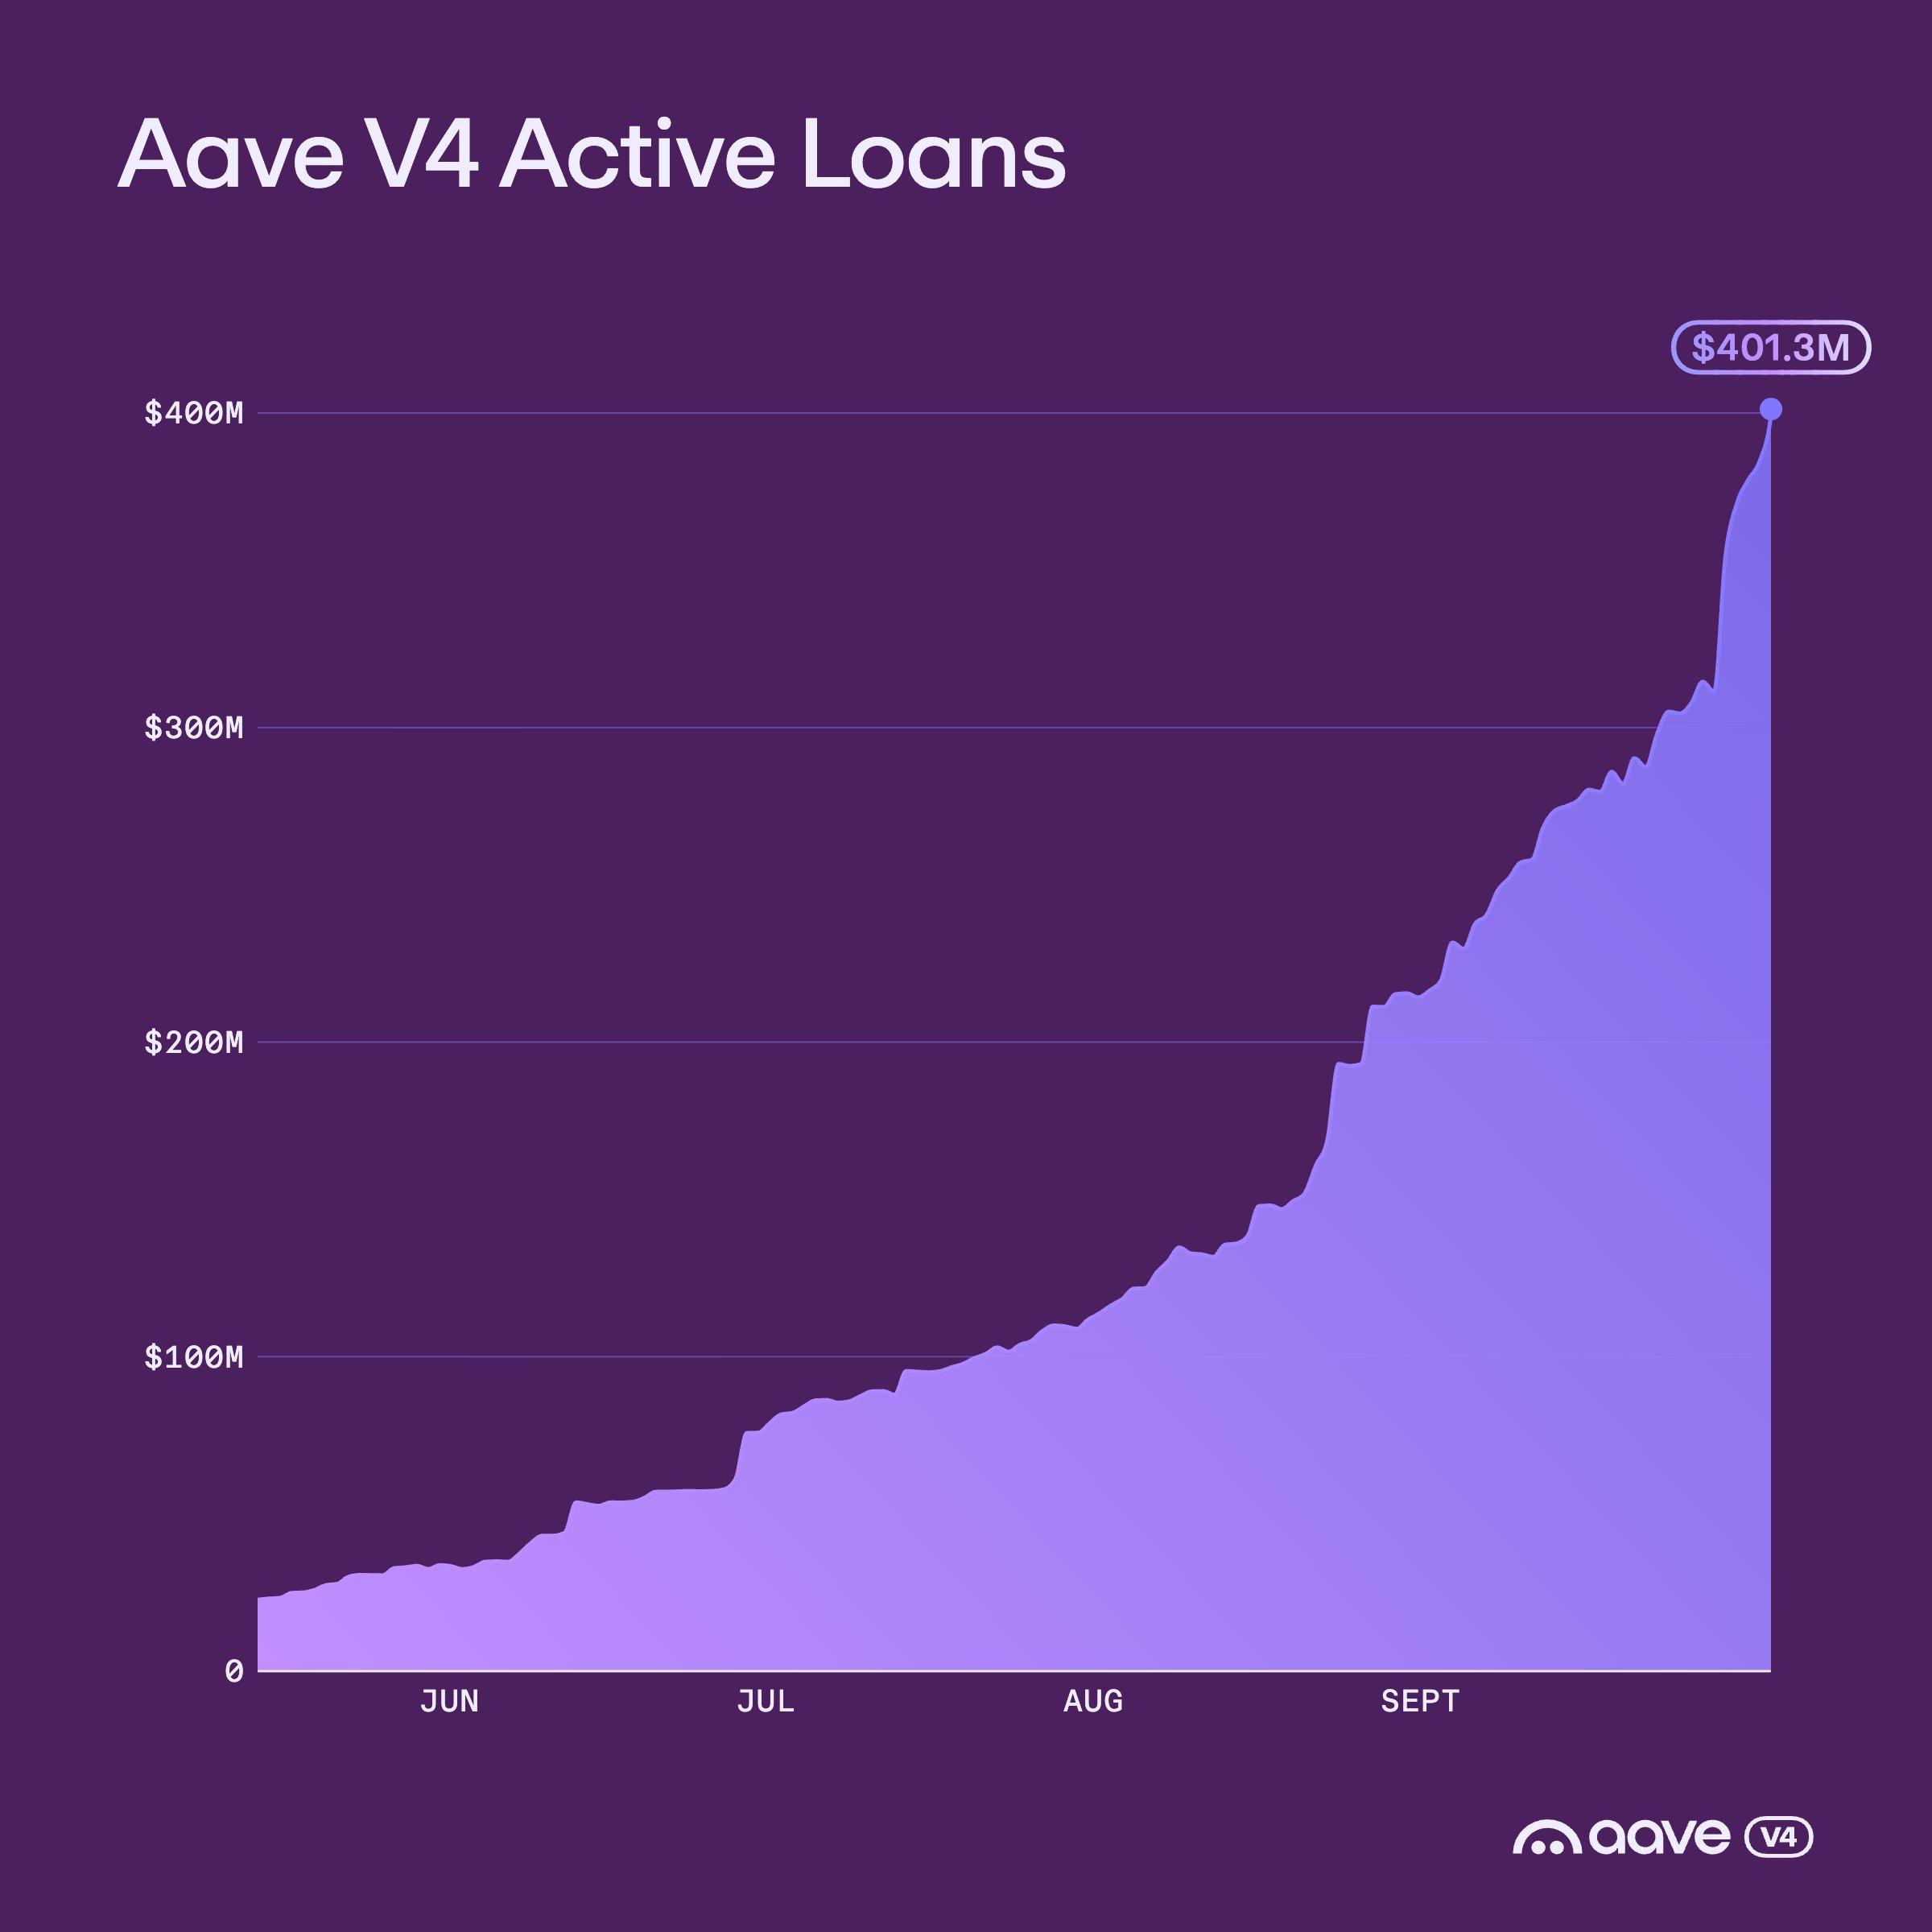
In addition, Aave posted on its X account on Wednesday that its V4 crossed $400 million in active loans, further highlighting strengthening demand and growing activity.
Aave technical outlook: Holds bullish bias

Aave price trades at $160.23 on Wednesday, maintaining a bullish near-term bias as price holds above the 50-day, 100-day and 200-day Exponential Moving Averages (EMAs), clustered between roughly $116.60 and $129.30. 

The horizontal level at $145.10 underpins the recent breakout phase. At the same time, the Relative Strength Index (RSI) at 64 remains in bullish territory without reaching overbought, and the Moving Average Convergence Divergence (MACD) remains positive, suggesting upward momentum is still constructive.

On the topside, immediate resistance is seen at the horizontal barrier near $178.71, where buyers could face profit-taking.

On the downside, initial support appears at $145.10, followed by the 50-day EMA at $129.29 and then the 100-day and 200-day EMAs around $116.72 and $116.59, which together form a deeper demand zone; below these, older structural supports at $88.73 and $60.96 sit far beneath the current market price and would come into focus only in the event of a sharp reversal.
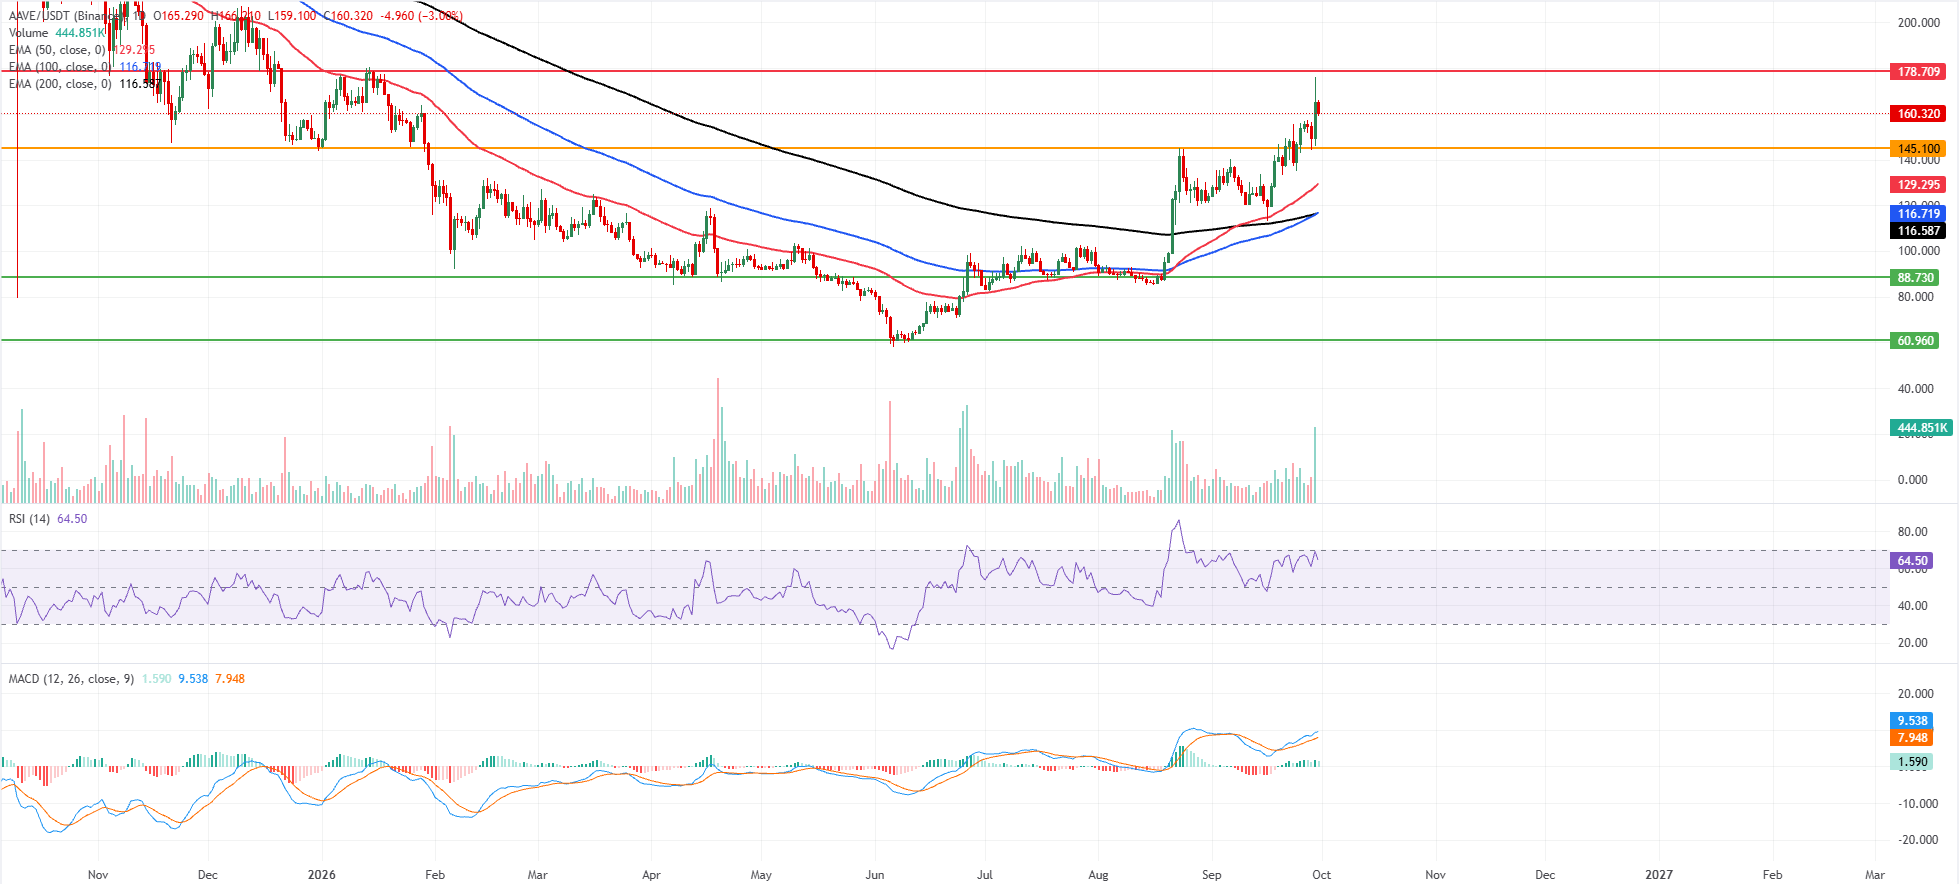
AAVE/USDT daily chart

(The technical analysis of this story was written with the help of an AI tool. Know more.)

Disclaimer: For information purposes only. Past performance is not indicative of future results.
placeholder
October hike odds climb toward 60% as Goldman and BofA both flip — what Warsh's "dose of accommodation" really changedRate futures now price roughly 55% to 62% for a 25bp hike at the October 27-28 FOMC, up from about 30% before Chair Warsh's post-meeting framing that the Fed is merely "removing some accommodation." Goldman Sachs has added an October hike to its forecast and Bank of America now sees moves in both October and December. Here is the repricing, the language behind it, and the two data points that decide it.
Author  Irene Q.
Sep 23, Wed
Rate futures now price roughly 55% to 62% for a 25bp hike at the October 27-28 FOMC, up from about 30% before Chair Warsh's post-meeting framing that the Fed is merely "removing some accommodation." Goldman Sachs has added an October hike to its forecast and Bank of America now sees moves in both October and December. Here is the repricing, the language behind it, and the two data points that decide it.
placeholder
Four jobs reports in five days: what JOLTS, ADP, claims and the September payrolls mean for the October Fed decisionThe US labour market faces its densest data week of the month. JOLTS job openings land Tuesday (7.2 million expected), ADP on Wednesday (70,000 expected), initial claims on Thursday and the September non-farm payrolls on Friday (100,000 expected, down from 162,000). Markets price a 64%-70% chance of another quarter-point Fed hike on October 28. The dollar index sits at 100.77 and the S&P 500 at 7,729.8.
Author  Mitrade
Sep 28, Mon
The US labour market faces its densest data week of the month. JOLTS job openings land Tuesday (7.2 million expected), ADP on Wednesday (70,000 expected), initial claims on Thursday and the September non-farm payrolls on Friday (100,000 expected, down from 162,000). Markets price a 64%-70% chance of another quarter-point Fed hike on October 28. The dollar index sits at 100.77 and the S&P 500 at 7,729.8.
placeholder
Nvidia's $150 billion buyback landed — and the AI sector fell anyway. That's the signal worth tradingNvidia closed up 1.68% at $228.86 on 28 September after announcing a $150 billion share repurchase authorisation, the largest single corporate buyback on record, while the rest of the AI complex sold off: AMD -3.6%, Micron -2.6%, Meta -4.8% and the Philadelphia Semiconductor Index -1.61%. The divergence is not noise. Capital is rotating toward cash-flow certainty, not abandoning the AI theme. With Micron reporting after the close on 30 September, here is what the split means.
Author  Irene Q.
Yesterday 06: 31
Nvidia closed up 1.68% at $228.86 on 28 September after announcing a $150 billion share repurchase authorisation, the largest single corporate buyback on record, while the rest of the AI complex sold off: AMD -3.6%, Micron -2.6%, Meta -4.8% and the Philadelphia Semiconductor Index -1.61%. The divergence is not noise. Capital is rotating toward cash-flow certainty, not abandoning the AI theme. With Micron reporting after the close on 30 September, here is what the split means.
placeholder
The 30-year Treasury just hit a 22-year high — and the bond market is not pricing the Fed, it is pricing the deficitThe 30-year Treasury yield closed at 5.56% on 28 September, the highest since June 2004, while the 10-year reached 5.24% and the 20-year 5.60%. The curve has steepened roughly 30bp in eight sessions even as October hike odds sit at 70.3%. That gap is the story: the long end is repricing fiscal and inflation risk, not policy. With PCE on Wednesday and payrolls on Friday, here is what the long end is really saying.
Author  Irene Q.
Yesterday 07: 08
The 30-year Treasury yield closed at 5.56% on 28 September, the highest since June 2004, while the 10-year reached 5.24% and the 20-year 5.60%. The curve has steepened roughly 30bp in eight sessions even as October hike odds sit at 70.3%. That gap is the story: the long end is repricing fiscal and inflation risk, not policy. With PCE on Wednesday and payrolls on Friday, here is what the long end is really saying.
placeholder
【Daily Brief】30-year Treasury tops 5.59%, S&P 500 slips to 7,670 and gold holds $4,180 — PCE lands tonightThe 30-year Treasury yield closed at 5.59%, its highest since June 2002, and the Dow fell 131.59 points to 51,349.92. US consumer confidence dropped to 81.9, a 12-year low, and JOLTS job openings fell to 7.1 million. August PCE and Q3 GDP both land at 8:30am ET tonight.
Author  Suzie
7 hours ago
The 30-year Treasury yield closed at 5.59%, its highest since June 2002, and the Dow fell 131.59 points to 51,349.92. US consumer confidence dropped to 81.9, a 12-year low, and JOLTS job openings fell to 7.1 million. August PCE and Q3 GDP both land at 8:30am ET tonight.
Related Instrument
goTop
quote