


Gold eyes weekly gain, but hawkish Fed outlook limits upside
- Gold heads for a weekly advance after bouncing from its lowest level in more than a month.
- Saudi supply developments pull Oil prices lower and help US Treasury yields retreat from recent peaks.
- XAU/USD holds below the Bollinger middle band at $4,421, while momentum indicators point to consolidation.
Gold (XAU/USD) struggles to move above the $4,400 level on Friday as the Federal Reserve’s (Fed) hawkish policy outlook keeps the US Dollar (USD) firmly bid. Still, the metal is on track for its first weekly gain in three weeks as a pullback in Oil prices drags US Treasury yields away from multi-year highs, helping Gold rebound from the more-than-one-month low of $4,235 touched on Wednesday. At the time of writing, XAU/USD trades around $4,380, up 0.90% on the day.
It has been a volatile week for Gold. The Fed raised interest rates by 25 basis points (bps) to the 3.75%-4.00% range on Wednesday, delivering its first increase since 2023. The decision pushed the US Dollar and Treasury yields higher, sending Gold sharply lower. The US Dollar Index (DXY), which tracks the Greenback's value against a basket of six major currencies, trades around 100.36 near seven-week highs.
However, the post-Fed pressure was offset by falling Oil prices, which eased after reports that Saudi Arabia is rerouting some exports and working to repair its East-West pipeline, which was damaged in an attack last week. The pipeline lets Saudi Oil reach the Red Sea without passing through the Strait of Hormuz.
What could be Gold’s path ahead?
The bigger question is whether Gold can build on its rebound. The Fed signalled that additional rate increases could come as policymakers remain committed to bringing inflation back to the central bank’s 2% target. The updated dot plot shows that 16 of 18 officials expect at least one more rate hike this year. The median policy-rate forecast stands at 4.1% for both 2026 and 2027, suggesting that officials do not expect to cut rates next year.
Higher borrowing costs increase the opportunity cost of holding non-yielding assets such as Gold. Traders currently see around a 55% chance of another increase at the October meeting, according to the CME FedWatch Tool.
At the same time, energy-related inflation risks have not disappeared. West Texas Intermediate Oil is down only around 0.63% near $96.00 heading into the weekend, despite positive developments around Saudi supply, while traffic through the Strait of Hormuz remains heavily restricted.
These risks are keeping US Treasury yields elevated despite their retreat from recent highs. The benchmark 10-year yield trades around 4.95%, up roughly 0.40% on the day and not far from the 2007 high of 5.04% touched earlier this week.
As a result, Gold faces a challenging backdrop. A stronger recovery may require a deeper fall in Oil prices, lower Treasury yields or a shift in Fed rate expectations. Even so, central-bank buying, strong investment demand and steady inflows into Gold-backed exchange-traded funds should support the metal over the longer term.
What to watch next week?
The US economic calendar is relatively light next week, but several Fed officials are scheduled to speak. Their comments could offer fresh clues about whether another rate increase is likely in October. Middle East developments will also remain in focus. Reuters reported that US President Donald Trump is expected to meet leaders or foreign ministers from Gulf Cooperation Council countries on the sidelines of the United Nations General Assembly on Tuesday.
Technical analysis: XAU/USD consolidates below Bollinger middle band
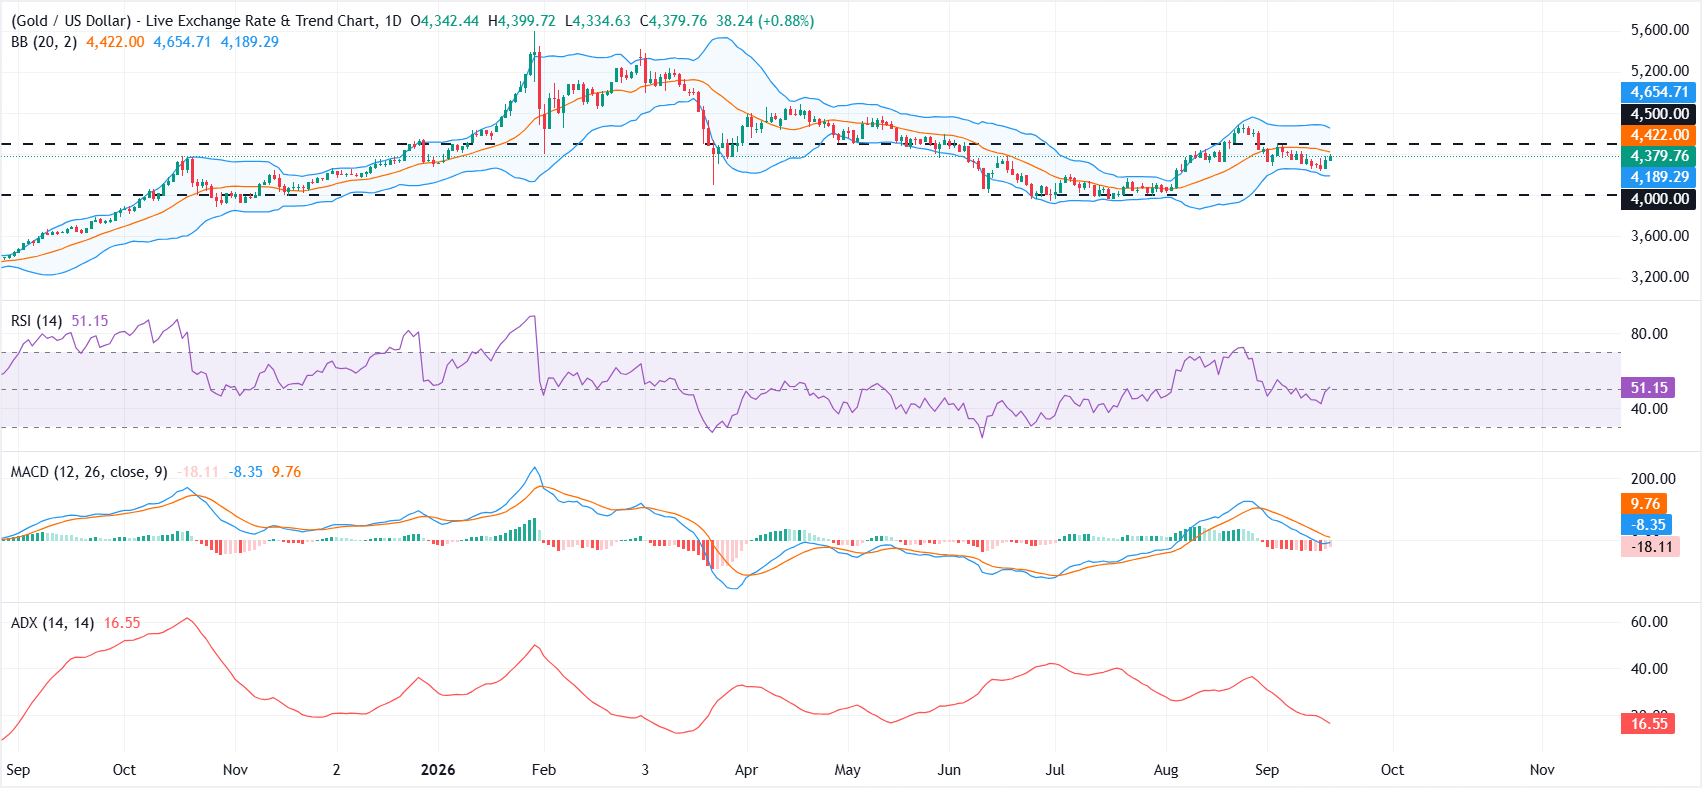
On the daily chart, XAU/USD trades under the Bollinger Bands 20-period Simple Moving Average (SMA) at $4,422, keeping the near-term tone mildly bearish. Momentum is mixed; the negative Moving Average Convergence Divergence (MACD) reading and a subdued Average Directional Index (ADX) at 16 hint that upside attempts are losing strength, with the neutral Relative Strength Index (RSI) around 51 suggesting consolidation rather than a strong directional move.
On the topside, initial resistance aligns with the Bollinger middle band at $4,422, followed by the psychological horizontal barrier at $4,500 and then the Bollinger upper band near $4,654. On the downside, immediate support emerges around the Bollinger lower band at $4,189, ahead of the more significant horizontal base at $4,000, where a deeper retracement would be expected to attract stronger dip-buying interest.
(The technical analysis of this story was written with the help of an AI tool. Know more.)
Gold FAQs
Gold has played a key role in human’s history as it has been widely used as a store of value and medium of exchange. Currently, apart from its shine and usage for jewelry, the precious metal is widely seen as a safe-haven asset, meaning that it is considered a good investment during turbulent times. Gold is also widely seen as a hedge against inflation and against depreciating currencies as it doesn’t rely on any specific issuer or government.
Central banks are the biggest Gold holders. In their aim to support their currencies in turbulent times, central banks tend to diversify their reserves and buy Gold to improve the perceived strength of the economy and the currency. High Gold reserves can be a source of trust for a country’s solvency. Central banks added 1,136 tonnes of Gold worth around $70 billion to their reserves in 2022, according to data from the World Gold Council. This is the highest yearly purchase since records began. Central banks from emerging economies such as China, India and Turkey are quickly increasing their Gold reserves.
Gold has an inverse correlation with the US Dollar and US Treasuries, which are both major reserve and safe-haven assets. When the Dollar depreciates, Gold tends to rise, enabling investors and central banks to diversify their assets in turbulent times. Gold is also inversely correlated with risk assets. A rally in the stock market tends to weaken Gold price, while sell-offs in riskier markets tend to favor the precious metal.
The price can move due to a wide range of factors. Geopolitical instability or fears of a deep recession can quickly make Gold price escalate due to its safe-haven status. As a yield-less asset, Gold tends to rise with lower interest rates, while higher cost of money usually weighs down on the yellow metal. Still, most moves depend on how the US Dollar (USD) behaves as the asset is priced in dollars (XAU/USD). A strong Dollar tends to keep the price of Gold controlled, whereas a weaker Dollar is likely to push Gold prices up.
Recommended Articles


