


US to delay new "overcapacity" tariffs on China — what the pause means for trade, inflation and the dollar

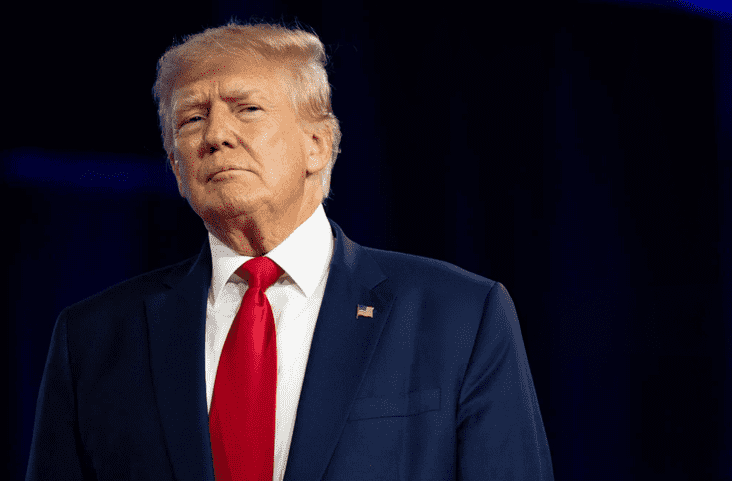
Washington is expected to hold off announcing new tariffs over trading partners' alleged "excess manufacturing capacity" until at least after next week's summit with China, according to Bloomberg, which cited people familiar with the matter. Inside US Trade first reported the delay. The postponed plan would have recommended a 7.5% levy on Chinese goods — a move that, combined with existing duties, would have taken second-term US tariffs on China back to around 20%. Beijing has previously said that level is consistent with the trade truce between the two sides.
The reason for the delay is unclear, and it remains uncertain whether the final rate will differ from the 7.5% that had been expected. What is clear is the market's first vote: Hong Kong's Hang Seng opened 119.56 points higher on Friday, and the Shanghai Composite opened up 0.42%. The offshore yuan traded at 6.6973, holding near the strong end of its recent range.
How we got here
The tariff threat did not appear out of nowhere. The sequence matters for judging how much of it is already priced.
| Date | What happened |
|---|---|
| March 2026 | The US launched Section 301 investigations into 16 economies — including China, South Korea, Japan, the EU and India — over excess capacity, plus a separate probe into 60 economies over forced labour |
| February 2026 | The Supreme Court struck down country-specific emergency tariffs, leaving the administration needing a new legal basis for its trade measures |
| July 2026 | The USTR imposed tariffs of up to 12.5% on South Korea, Japan and 58 other partners over forced-labour concerns |
| 10 September 2026 | China's Commerce Ministry said the two sides were "maintaining close communication" on tariff matters |
| 17 September 2026 | China's Commerce Ministry repeated that message; Wang Yi spoke by phone with US Secretary of State Marco Rubio about Middle East issues |
| 18 September 2026 | Bloomberg reports the "overcapacity" tariff announcement is being held until after the summit |
The excess-capacity tariffs were designed to replace the emergency duties the Supreme Court struck down — which is why the timing, not just the size, carries weight.
What is actually on the table
Three buckets of goods dominate the negotiation, and each has a different constituency:
Agriculture. China committed at the Busan summit to buy 25 million tonnes of US soybeans annually through 2028. Beijing has not publicly acknowledged that commitment, but Chinese purchases this year are reported to have passed half the annual target already.
Energy. US energy exports are among the items under discussion for tariff relief. A $30 billion reciprocal tariff-cut package — covering US energy and agricultural exports on one side, and Chinese industrial inputs and components on the other — was flagged after the May summit.
Rare earths. Still unresolved, and the sticking point that matters most for US aerospace and semiconductor firms.
Two-way goods trade between China and the US reached 2.76 trillion yuan (about $412 billion) in the first eight months of 2026, up 1.3% year on year — a reminder that the relationship is still worth arguing over.
Two scenarios, and what each means for markets
| Scenario | What it looks like | Yuan (USDCNH) | HK/China equities | Dollar |
|---|---|---|---|---|
| Deal / truce extended | The summit produces a tariff-cut package and a rollover of the truce; rare earths get a side agreement | Yields toward 6.65 ~ 6.68 (yuan stronger) | HK50 retests the 26,000 zone | Softer — trade risk premium fades |
| No deal / tariffs re-announced | Talks stall; the 7.5% "overcapacity" levy is published after the summit | Back toward 6.72 ~ 6.75 | HK50 slides toward 24,400 support | Firmer on safe-haven demand and higher inflation expectations |
Both paths run through the same gate: inflation. Tariffs were explicitly named among the price pressures the Fed is watching when it delivered its first rate hike since 2023 on 16 September, lifting the funds rate to 3.75% ~ 4.00% and signalling at least one more increase this year. A tariff reduction would ease that pressure; a re-escalation would add to it — and, by extension, to the case for keeping rates higher for longer.
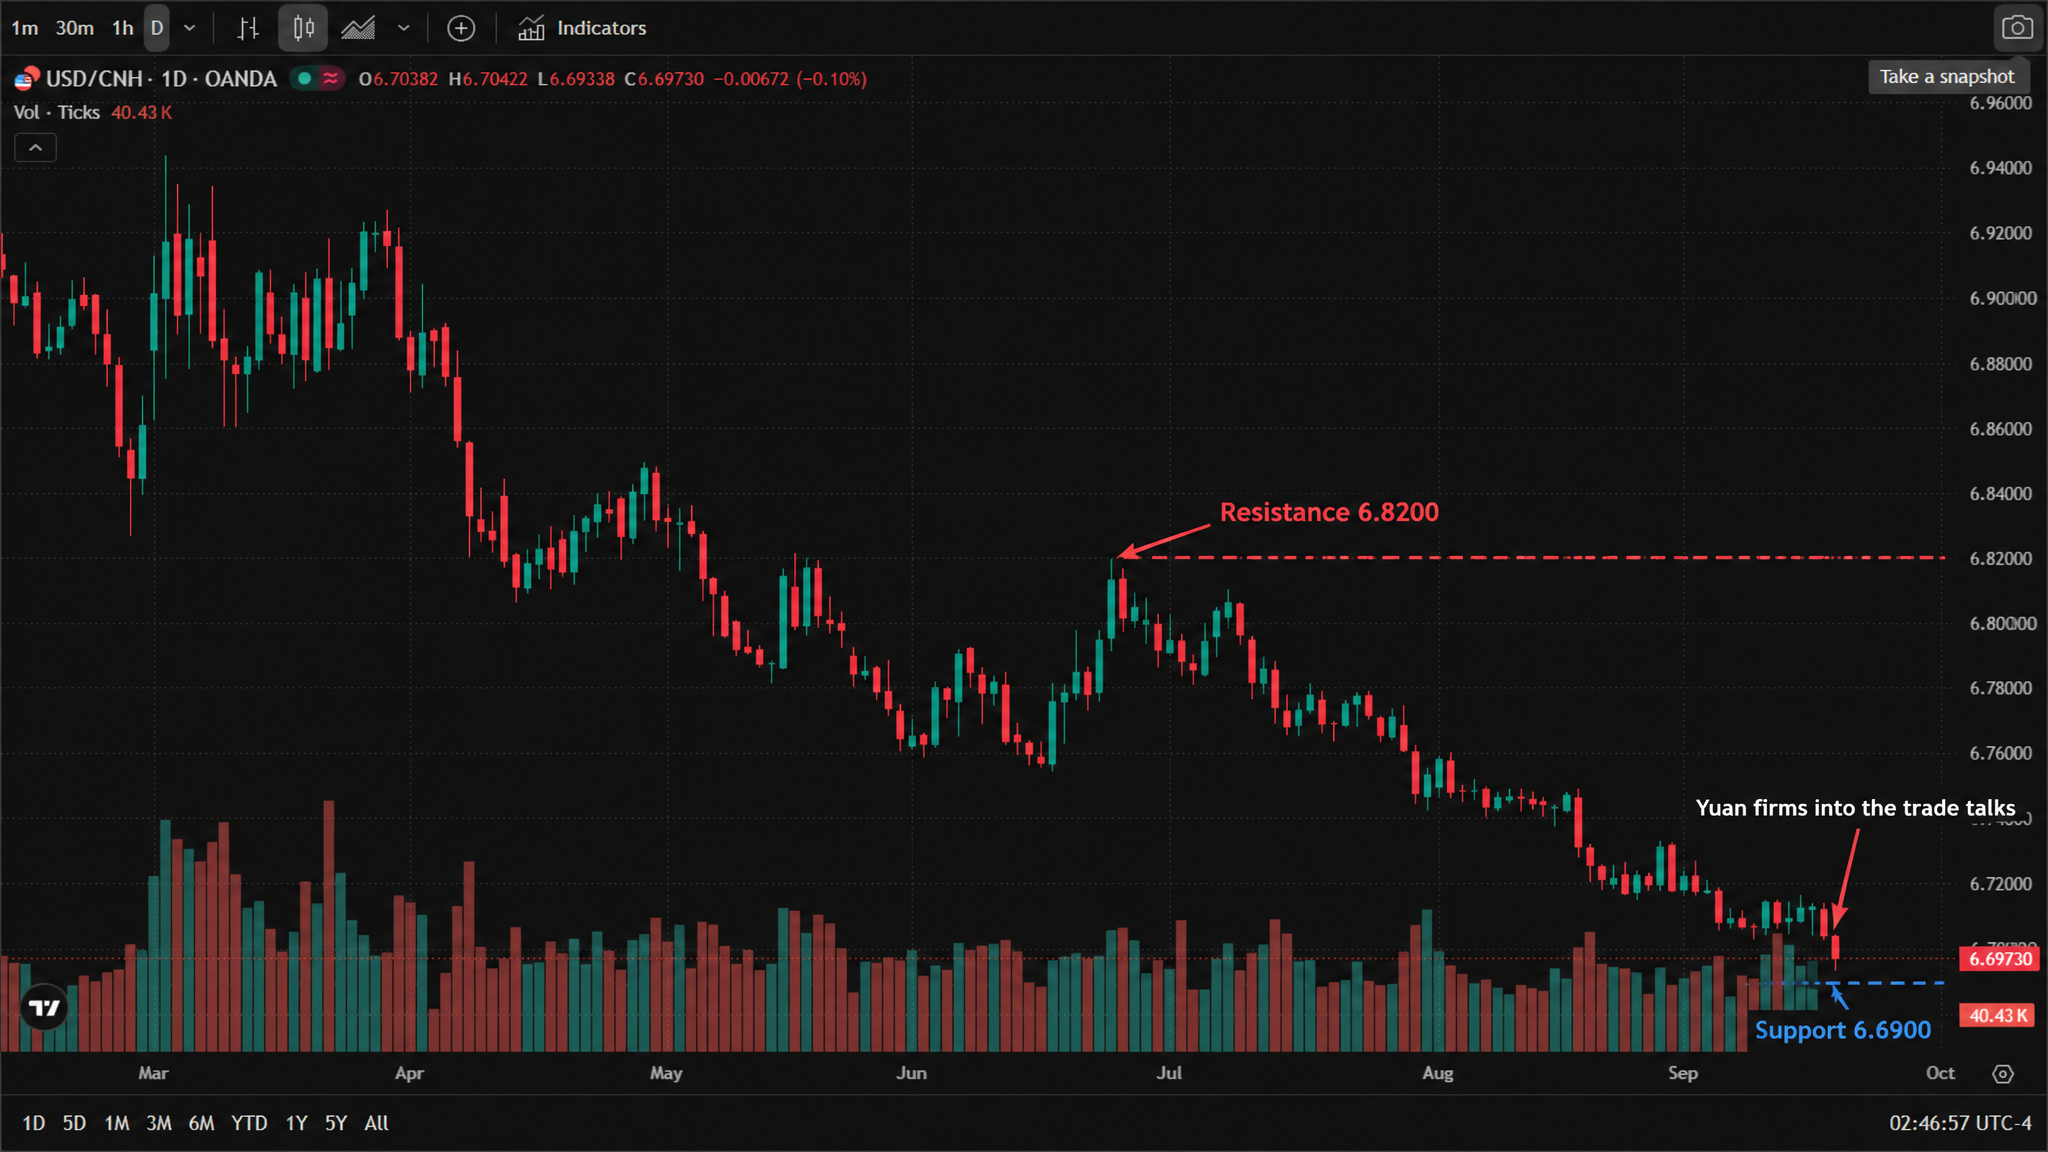
* Chart source: official TradingView chart screenshot, OANDA data feed (USD/CNH), captured 18 September 2026, 02:46 (New York time).
The Hong Kong read
Hong Kong is where the trade story shows up first, because it is the most liquid offshore venue for Chinese risk. The Hang Seng Index traded at 24,801.7 on Friday, up 148.7 points (+0.60%), with the day's range between 24,613.0 and 24,852.5.
Flows have been supportive. Southbound money from the mainland has now been a net buyer for nine consecutive sessions, for a cumulative HK$30.9 billion, with southbound turnover accounting for roughly 42% of total Hang Seng turnover. On Thursday's session, the biggest southbound additions were in AI-related names, while Alibaba saw the largest net outflow — a useful reminder that the index-level bid is not evenly distributed.
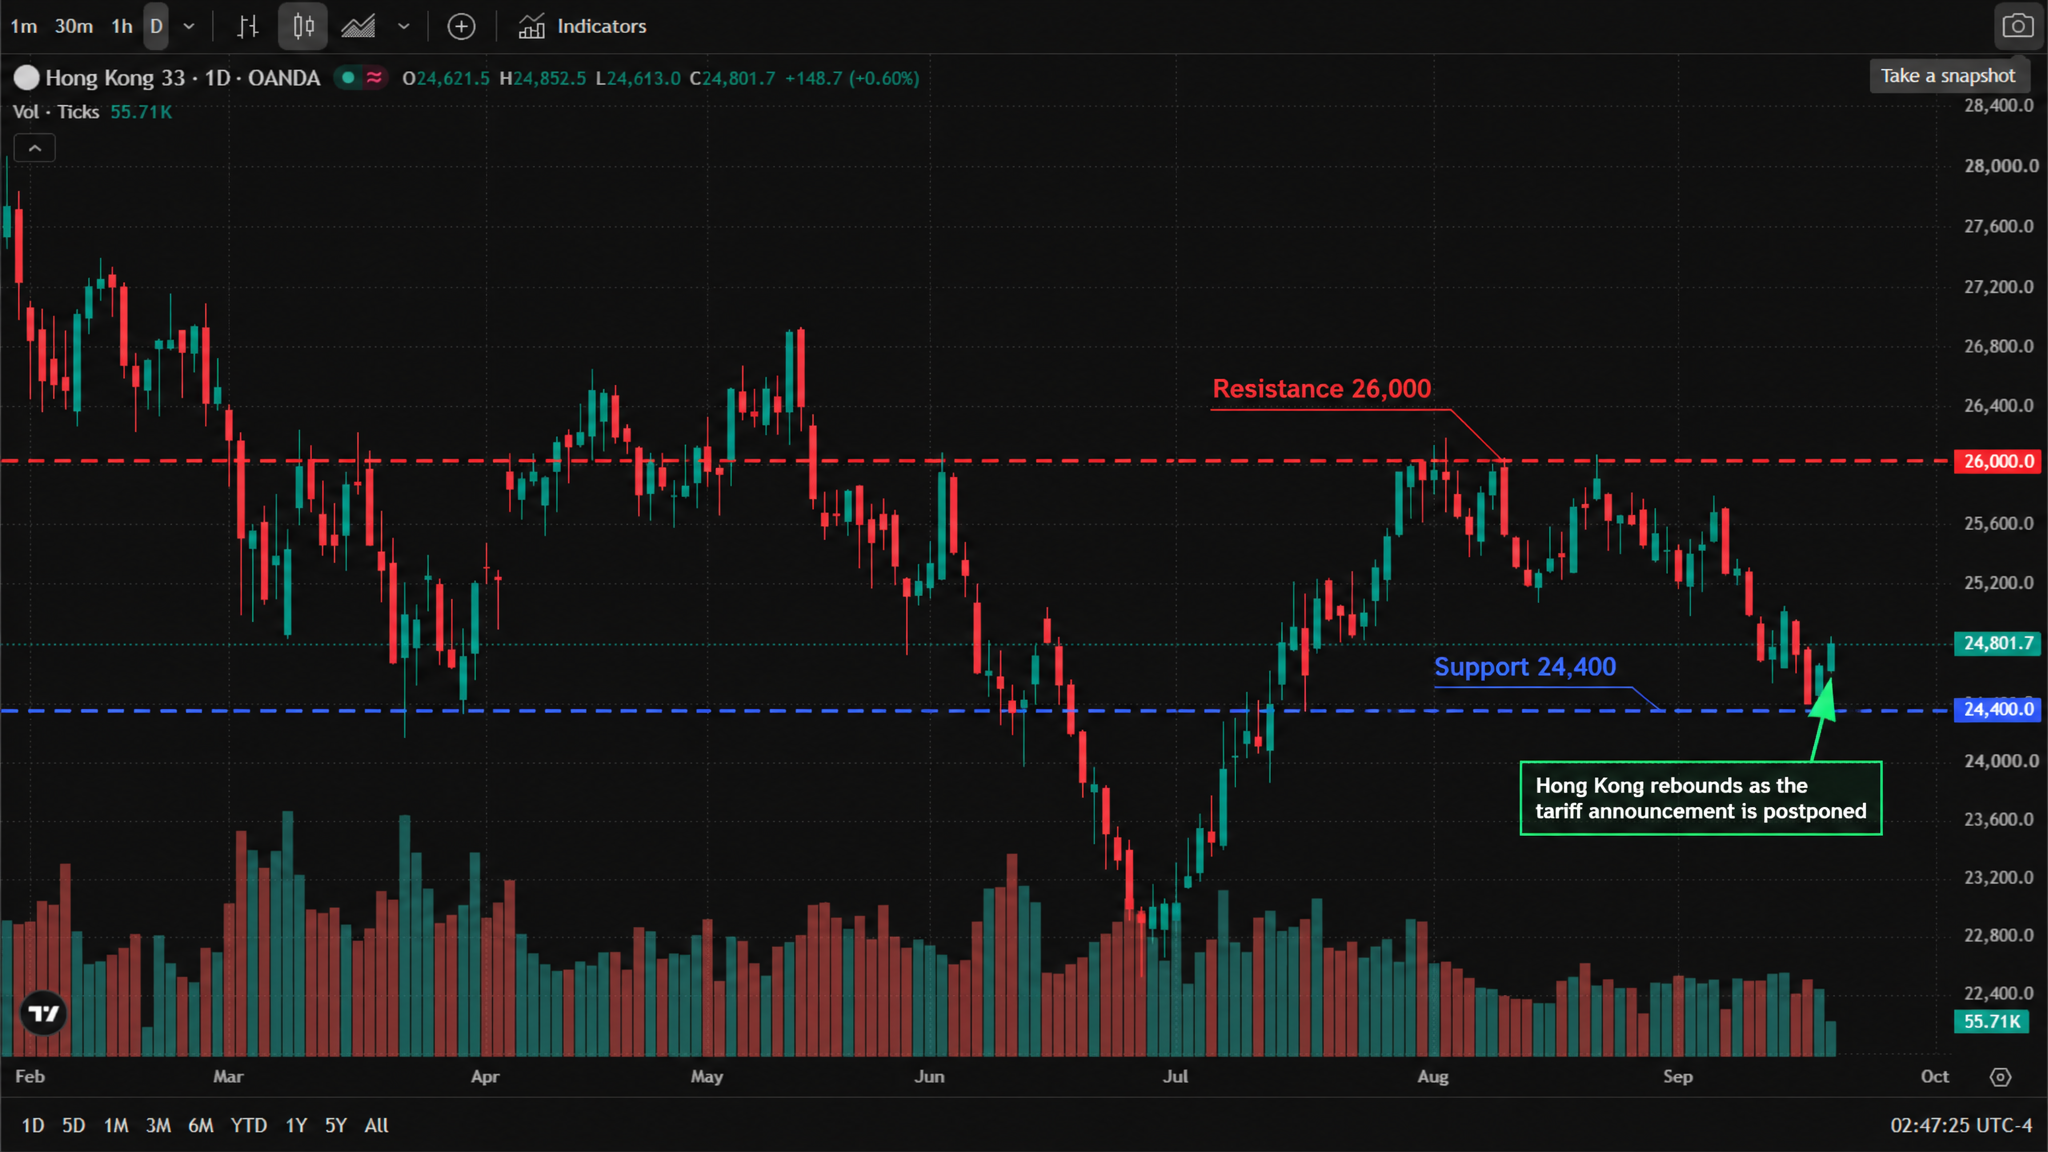
* Chart source: official TradingView chart screenshot, OANDA data feed (Hong Kong 33 / Hang Seng Index), captured 18 September 2026, 02:47 (New York time).
What to watch
This weekend: Treasury Secretary Scott Bessent meets Vice Premier He Lifeng in New York, with the US Trade Representative also attending. That meeting sets the tone for the summit.
24 September: the summit itself, in Washington. Trade, the conflict involving Iran, and artificial intelligence are all on the agenda.
The rate question: October Fed hike odds sit near 51% ~ 53%, up from around 27% a week ago. Anything that lowers import prices works against that pricing.
What would confirm the truce: an official announcement of the tariff delay — so far the reporting rests on people familiar with the matter, not a published decision. Until then, treat the pause as reported, not confirmed.
Related reads: for how the Fed's first hike in three years repriced the dollar, see Dollar index tops 100 for the first time since July; for the equities side of that same decision, see Dow drops 631 points as the Fed hikes.
Read more
Disclaimer: The content available on Mitrade Insights is provided for informational and marketing purposes only. It has not been prepared in accordance with legal requirements designed to promote the independence of investment research and is not subject to any prohibition on dealing ahead of the dissemination of investment research.
Nothing in this material constitutes investment advice, personal recommendation, investment research, an offer, or a solicitation to buy or sell any financial instrument. The content has been prepared without consideration of your individual investment objectives, financial situation, or needs, and should not be treated as such.
Past performance is not a reliable indicator of future performance and/or results. Forward-looking scenarios or forecasts are not a guarantee of future performance. Actual results may differ materially from those anticipated.
Mitrade makes no representation or warranty as to the accuracy or completeness of the information provided and accepts no liability for any loss arising from reliance on such information.


