


Ripple Price Forecast: XRP bulls battle to retain control amid growing whale inflows
- XRP gains ground and reclaims the $1.32 support level, but the 200-day EMA resistance could limit recovery.
- Whale inflows to Binance increase, reaching a six-month high of 1.6 billion XRP, but supply threatens recovery.
- The XRP technical structure shows stability, with the RSI rising near the midline and the 50-day and 100-day EMAs providing support.
Ripple (XRP) ticks up and trades above $1.32 on Friday. Bulls are slowly returning to the market as dust from this week’s macro crosswinds and regulatory headwinds settles.
Macro and regulatory headwinds ease
The United States (US) Federal Reserve (Fed) 25 basis point interest rate hike to the 3.75%-4.00% range was widely priced in and largely expected; hence, the prevailing stability and signs of a short-term recovery.
Earlier, the US Senate failed to pass the CLARITY Act, a comprehensive market structure framework for regulating the crypto industry. The bill now faces greater uncertainty ahead of the mid-term elections, with analysts foreseeing the possibility of a new bill beginning next year.
“The legislative setback is worth watching. The failure of the CLARITY Act to advance delays regulatory certainty and leaves further progress dependent on SEC and CFTC rulemaking,” the Crypto Finance team said in an emailed report, adding, “yet the muted price reaction reinforces the idea that regulation is currently a secondary driver compared with macro liquidity and institutional positioning.”
XRP whale inflows to Binance surge
On-chain data shows a significant increase in XRP large-volume inflows to Binance, with total inflows over the past 30 days reaching around 1.5 billion XRP. This marks the highest level since last March, according to CryptoQuant.
The surge reflects a steady pattern in transfers from large wallets to Binance compared with previous months. It also ends an extended decline in the metric since March and a recovery from May, June and July lows.
Still, growth in exchange inflows is often considered bearish for the underlying asset, as they increase available supply in the market. In other words, larger exchange balances suggest investors are preparing to trade or sell the token, which can weigh on price action.
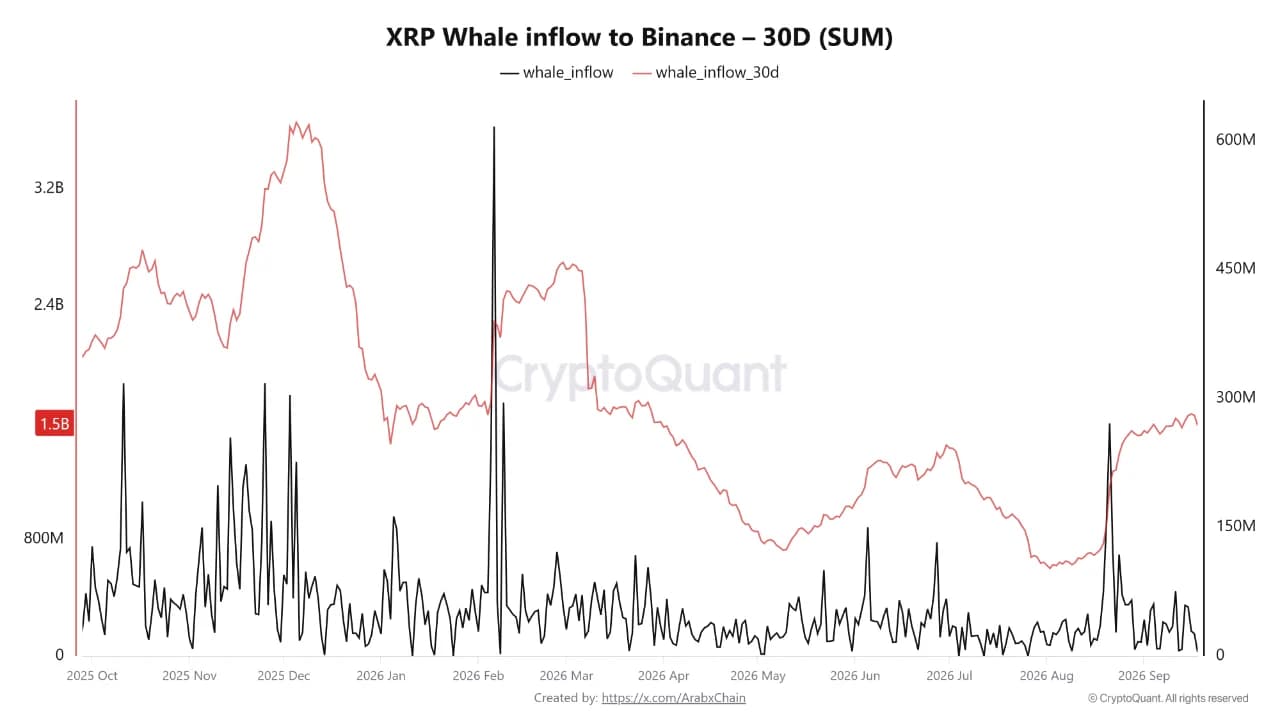
“If inflows rise without a corresponding increase in selling pressure, the movement may reflect trading activity or a repositioning of holdings rather than an immediate intent to liquidate,” Arab Chain stated on CryptoQuant.
Technical analysis: XRP recovers as bulls defend support
XRP trades at $1.33, holding a constructive near-term bullish bias as price stays above the 50-day, 100-day and 200-day Exponential Moving Averages (EMAs). The 50-day EMA at $1.29, the 100-day EMA at $1.26 and the SuperTrend line at $1.25 collectively form a rising demand zone underpinning the advance.
At the same time, the Relative Strength Index (RSI) near 49 suggests neutral momentum after cooling from overbought conditions. The Moving Average Convergence Divergence (MACD) indicator remains slightly negative, with the line below its signal and the histogram contracting, hinting at a pause in upside pressure rather than a decisive reversal.
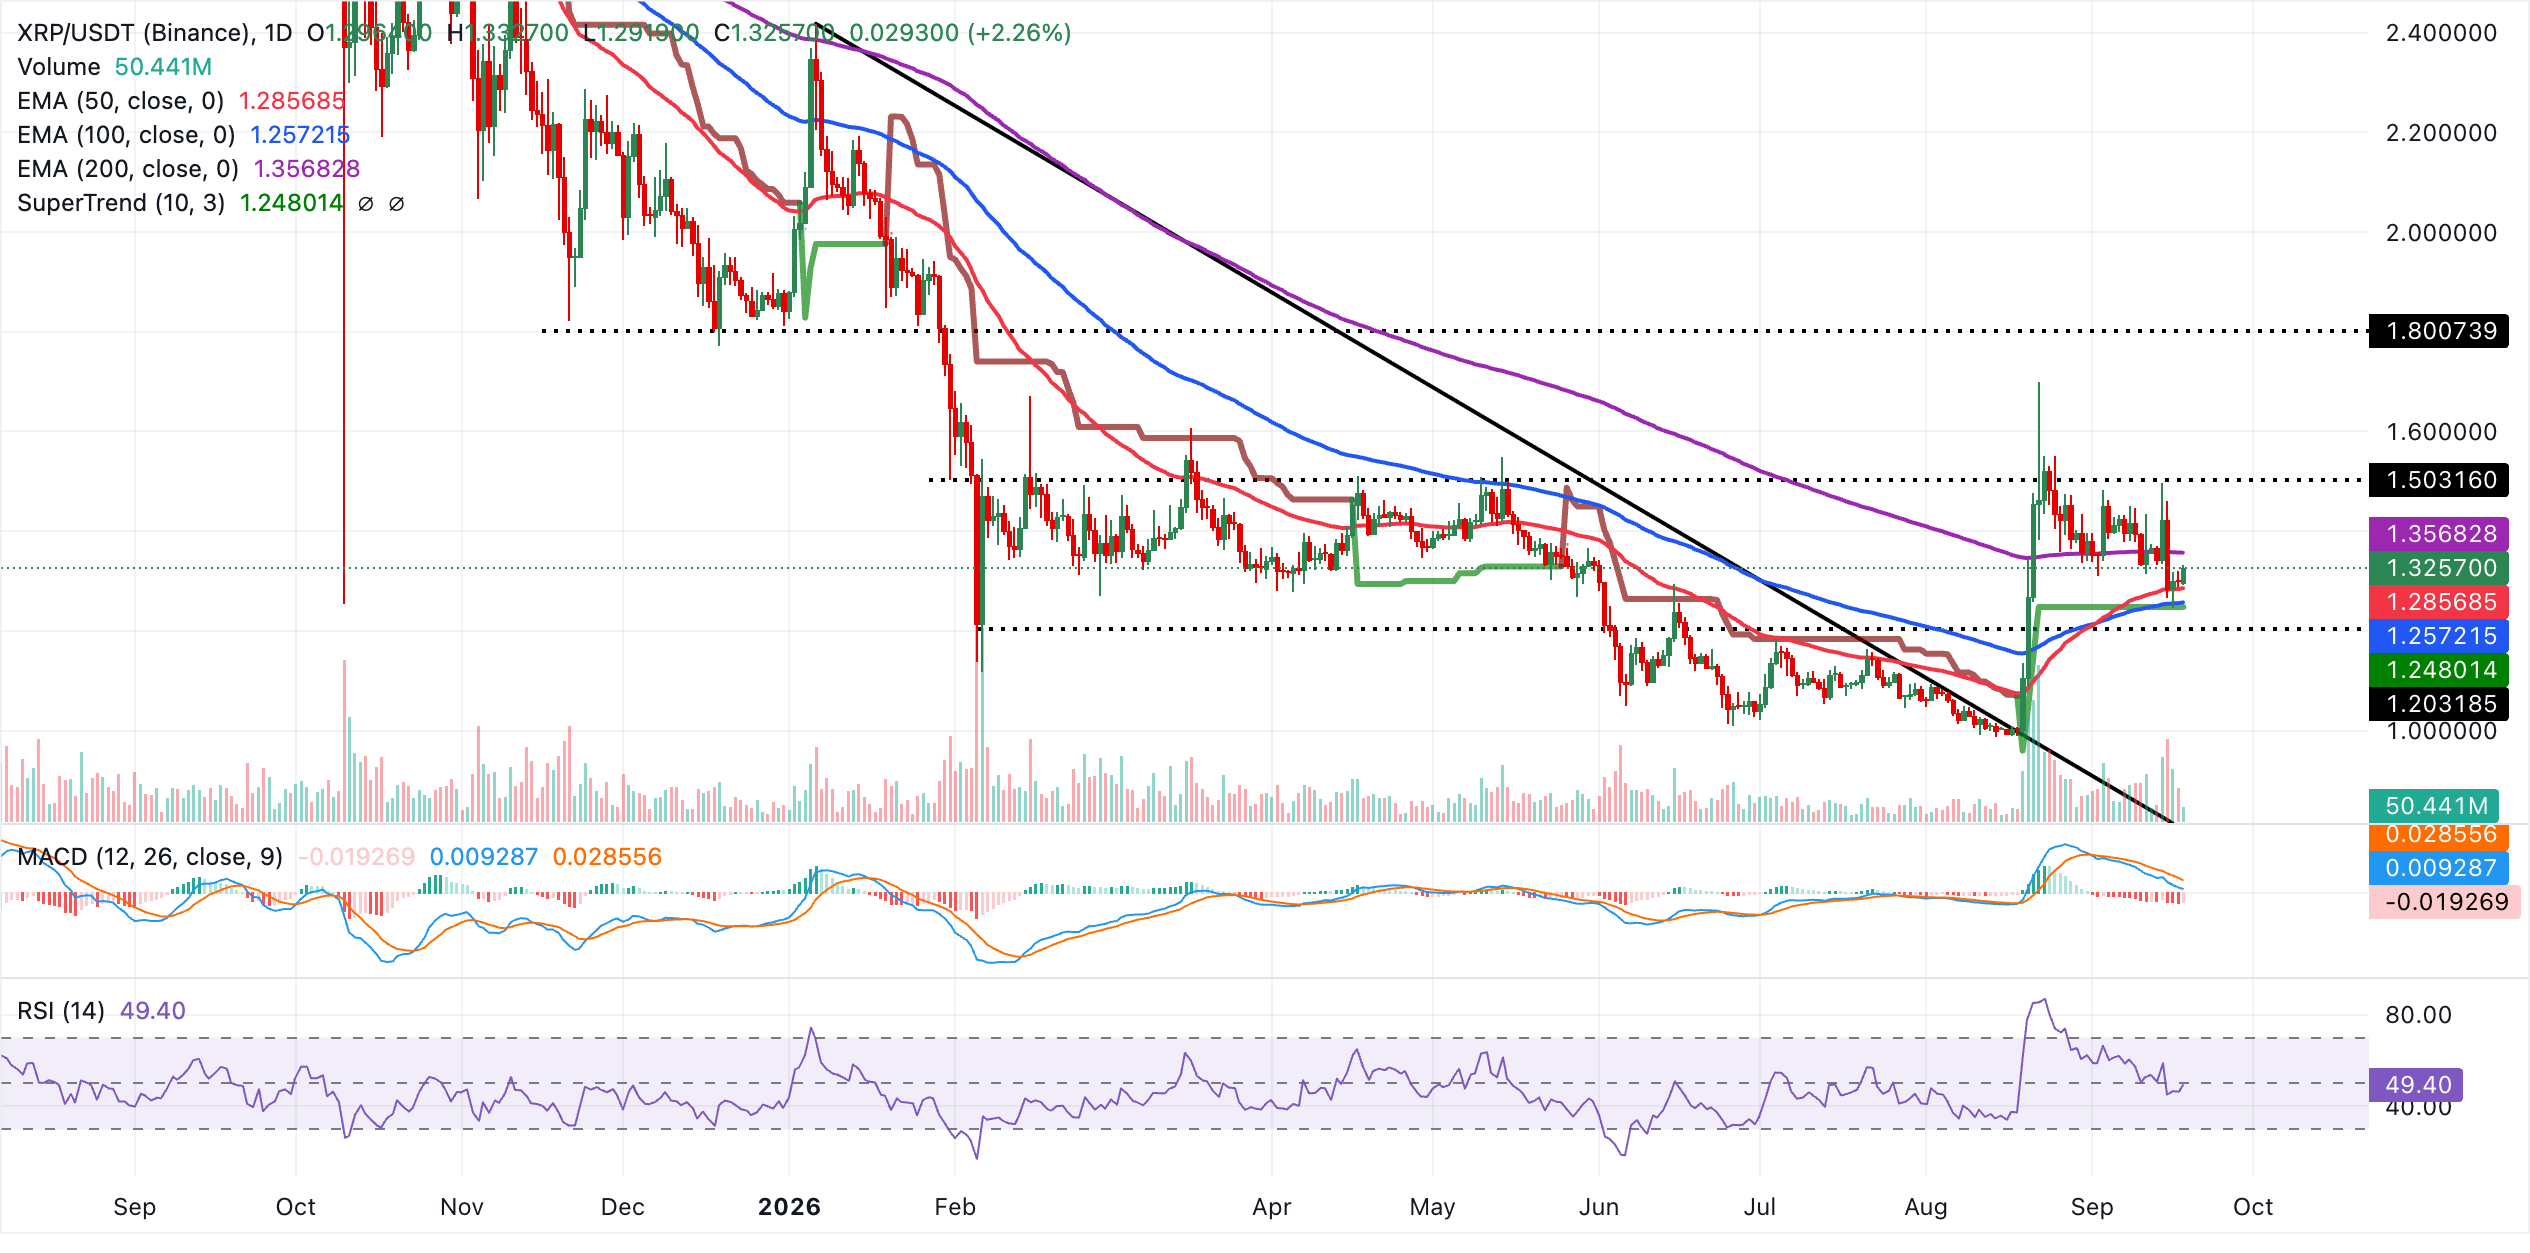
On the downside, initial support lies in the current trading area around $1.33, followed by the 50-day EMA at $1.29 and then the 100-day EMA at $1.26, with the SuperTrend base at $1.25 reinforcing a broader floor above the historical trendline-break region near $0.80. On the topside, the 200-day EMA at $1.36 is the next key resistance to reclaim. A sustained move above this level would strengthen the bullish bias and open the way for a continuation of the broader recovery phase.
(The technical analysis of this story was written with the help of an AI tool. Know more.)
Cryptocurrency metrics FAQs
The developer or creator of each cryptocurrency decides on the total number of tokens that can be minted or issued. Only a certain number of these assets can be minted by mining, staking or other mechanisms. This is defined by the algorithm of the underlying blockchain technology. On the other hand, circulating supply can also be decreased via actions such as burning tokens, or mistakenly sending assets to addresses of other incompatible blockchains.
Market capitalization is the result of multiplying the circulating supply of a certain asset by the asset’s current market value.
Trading volume refers to the total number of tokens for a specific asset that has been transacted or exchanged between buyers and sellers within set trading hours, for example, 24 hours. It is used to gauge market sentiment, this metric combines all volumes on centralized exchanges and decentralized exchanges. Increasing trading volume often denotes the demand for a certain asset as more people are buying and selling the cryptocurrency.
Funding rates are a concept designed to encourage traders to take positions and ensure perpetual contract prices match spot markets. It defines a mechanism by exchanges to ensure that future prices and index prices periodic payments regularly converge. When the funding rate is positive, the price of the perpetual contract is higher than the mark price. This means traders who are bullish and have opened long positions pay traders who are in short positions. On the other hand, a negative funding rate means perpetual prices are below the mark price, and hence traders with short positions pay traders who have opened long positions.
Recommended Articles


