

GBP/JPY Price Forecast: Bulls challenge 210.00 as breakout looms

Source Fxstreet
  • GBP/JPY extends gains as buyers challenge descending resistance near 210.00.
  • RSI approaches neutral, signaling improving momentum despite broader consolidation.
  • Break above 210.00 exposes 211.28 and 50-day SMA at 211.84.

The GBP/JPY extends its modest gains for two straight days, up 0.16% as the cross-pair continues to consolidate near the 210.00 figure with no clear bias, while the Relative Strength Index (RSI) drifts higher towards its 50-neutral level, an indication that buyers are stepping in.

GBP/JPY Price Forecast: Technical outlook

As of writing, a downslope resistance trendline near 209.80-210.00 is being tested by buyers, who were quickly rejected on Monday after hitting a weekly high of 209.99.

Worth noting that the day’s price action shows that buying pressure is building after GBP/JPY reached a low of the day (LOD) below 209.00, respecting a support trendline tested three times, an indication that further upside is seen.

A decisive breakout above 210.00. puts into play the September 18 cycle high of 211.28. Further gains are seen beyond that area, with the 50-day SMA seen as a key supply zone at 211.84.

Conversely, for a bearish continuation, GBP/JPY must drop below 209.00 and clear the support trendline, which caps losses, with the next support at 206.89, the September 30 low.

GBP/JPY Price Forecast: Technical outlook
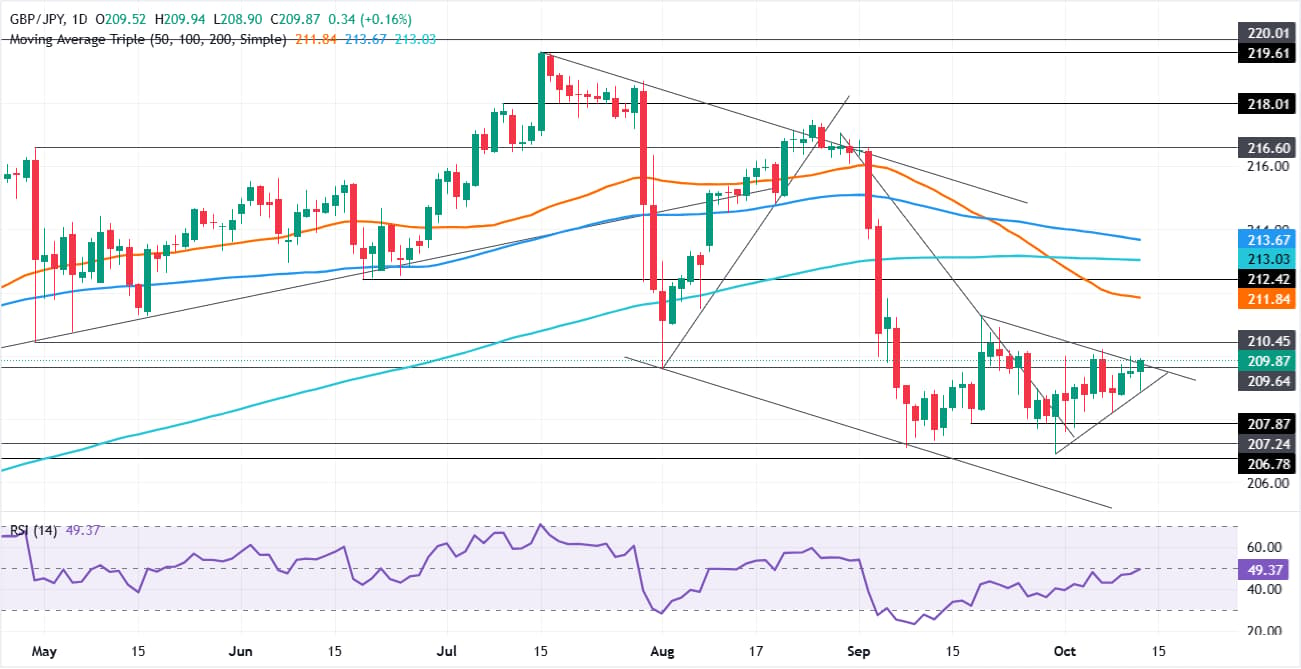
GBP/JPY daily chart

Japanese Yen Price Today

The table below shows the percentage change of Japanese Yen (JPY) against listed major currencies today. Japanese Yen was the strongest against the US Dollar.

USD EUR GBP JPY CAD AUD NZD CHF
USD -0.38% -0.34% -0.17% -0.45% -0.34% -0.46% -0.26%
EUR 0.38% 0.03% 0.21% -0.05% 0.03% -0.07% 0.13%
GBP 0.34% -0.03% 0.15% -0.13% -0.01% -0.14% 0.10%
JPY 0.17% -0.21% -0.15% -0.27% -0.16% -0.28% -0.06%
CAD 0.45% 0.05% 0.13% 0.27% 0.11% -0.01% 0.21%
AUD 0.34% -0.03% 0.01% 0.16% -0.11% -0.12% 0.09%
NZD 0.46% 0.07% 0.14% 0.28% 0.00% 0.12% 0.23%
CHF 0.26% -0.13% -0.10% 0.06% -0.21% -0.09% -0.23%

The heat map shows percentage changes of major currencies against each other. The base currency is picked from the left column, while the quote currency is picked from the top row. For example, if you pick the Japanese Yen from the left column and move along the horizontal line to the US Dollar, the percentage change displayed in the box will represent JPY (base)/USD (quote).

Disclaimer: For information purposes only. Past performance is not indicative of future results.
placeholder
October hike odds climb toward 60% as Goldman and BofA both flip — what Warsh's "dose of accommodation" really changedRate futures now price roughly 55% to 62% for a 25bp hike at the October 27-28 FOMC, up from about 30% before Chair Warsh's post-meeting framing that the Fed is merely "removing some accommodation." Goldman Sachs has added an October hike to its forecast and Bank of America now sees moves in both October and December. Here is the repricing, the language behind it, and the two data points that decide it.
Author  Irene Q.
Sep 23, Wed
Rate futures now price roughly 55% to 62% for a 25bp hike at the October 27-28 FOMC, up from about 30% before Chair Warsh's post-meeting framing that the Fed is merely "removing some accommodation." Goldman Sachs has added an October hike to its forecast and Bank of America now sees moves in both October and December. Here is the repricing, the language behind it, and the two data points that decide it.
placeholder
Strong profits, falling shares: bank earnings day one meets a memory-chip rout — with CPI and ASML aheadGoldman Sachs blew past estimates (EPS $17.01 vs $13.09 expected, profit +33%) while JPMorgan missed ($5.75 vs $5.93) and Wells Fargo fell 3% — yet the S&P 500 finished flat at 7,805.45, pinned below its record close as a memory-chip rout (SOX −2.67%, Micron under $1,000) kept the pressure on. Tonight brings the week's decider: US September CPI at 8:30 ET, then Bank of America, Morgan Stanley, BlackRock and ASML before the open. Here are the levels, both cases, and the watch list.
Author  Irene Q.
Oct 14, Wed
Goldman Sachs blew past estimates (EPS $17.01 vs $13.09 expected, profit +33%) while JPMorgan missed ($5.75 vs $5.93) and Wells Fargo fell 3% — yet the S&P 500 finished flat at 7,805.45, pinned below its record close as a memory-chip rout (SOX −2.67%, Micron under $1,000) kept the pressure on. Tonight brings the week's decider: US September CPI at 8:30 ET, then Bank of America, Morgan Stanley, BlackRock and ASML before the open. Here are the levels, both cases, and the watch list.
placeholder
US September CPI recap: inflation hits 3.7% as core runs hot — is an October Fed hike back on the table?September CPI landed hot: headline 3.7% y/y, core 2.6% y/y and 0.3% m/m. October hike odds jumped from ~22% to ~37% — yet the dollar faded to 101.74, gold closed higher and the S&P 500 fell 1.11%. Here is the full repricing, the levels and what to watch next.
Author  Irene Q.
Yesterday 05: 52
September CPI landed hot: headline 3.7% y/y, core 2.6% y/y and 0.3% m/m. October hike odds jumped from ~22% to ~37% — yet the dollar faded to 101.74, gold closed higher and the S&P 500 fell 1.11%. Here is the full repricing, the levels and what to watch next.
placeholder
Gold defends $4,100 as BofA targets a break below $4,000 — why the Middle East bid is missingSpot gold flushed to $4,099.89, a whisker above October's $4,090 low, then rebounded to close at $4,138.25 (+0.82%) — even as US CPI ran hot. Bank of America sees gold below $4,000 within three months, citing shrinking demand and official-sector selling. Here are the levels, the drivers and what would flip the script.
Author  Irene Q.
Yesterday 06: 57
Spot gold flushed to $4,099.89, a whisker above October's $4,090 low, then rebounded to close at $4,138.25 (+0.82%) — even as US CPI ran hot. Bank of America sees gold below $4,000 within three months, citing shrinking demand and official-sector selling. Here are the levels, the drivers and what would flip the script.
placeholder
Gold Price Analysis Today | Forex Gold Analysis | XAU/USD Analysis - October 15, 2026Get the latest gold price analysis, forex gold insights, and XAU/USD analysis for October 15, 2026. Read on for the details.
Author  Mitrade
2 hours ago
Get the latest gold price analysis, forex gold insights, and XAU/USD analysis for October 15, 2026. Read on for the details.
Related Instrument
goTop
quote