


Rocket Lab Stock Forecast: Neutron Slips to 2027 as RKLB Tests $55 Support and Iridium Raises the Stakes
TradingKey - Shares of Rocket Lab (RKLB) were down 6.64%, to close at $55.25, on Thursday, October 15, after slipping as much as 16% intraday, following Rocket Lab's disclosure that the first Neutron launch has been moved to 2027. This extended a six-session losing streak, now about 21%.
My thesis is that the core business is healthy and the growth story now relies on 2 key things the market cannot price with certainty: Execution of Neutron and the financing of the $8bn Iridium deal. The Q3 report in November is the next catalyst.
Why the Neutron Delay Matters
Neutron is Rocket Lab's medium-lift, reusable rocket, to compete with SpaceX's Falcon 9, and carry a lot bigger payloads than Electron. In its October 14 report, Rocket Lab mentioned that the first launch would move to next year as the team incorporates process improvements, and works through manufacturing and testing milestones.
This is at least the third slip by management, who had already pushed the first launch to the end of 2026. The latest delay is also attributed to a propellant dome manufacturing problem that management said is now resolved. The key issue is, can we believe management? Neutron will help Rocket Lab win the bigger, and more lucrative, launch contracts.
The Core Business Is Still Growing Fast
Revenue in Q2 reached a new high of $234.1 million, up 62% year-over-year. Backlog also reached a new high, increasing 137% to $2.36 billion.
While Neutron continues to significantly affect adjusted EBITDA, showing an loss of $8.8 million, the space systems and launch business are on track to reach breakeven.
Margins Are Guided Lower in Q3
Rocket Lab expects revenue to range between $250 million and $265 million for Q3, but non-GAAP gross margin to be in the range of 35-37% and an adjusted EBITDA loss between $17 and $23 million.
Q2 non-GAAP gross margin improved to 41.5%. Rocket Lab attributed the Q3 step-down to a less favorable revenue mix. A negative revenue mix would likely lead to lower gross margins, but in the long-term, gross margins would need to be above 35% in order for the company to be profitable.
Cash Burn and Dilution
While liquidity is not Rocket Lab's immediate challenge, the company ended the quarter with about $2.13 billion of cash, and about $2.4 billion of total liquidity. About $1.08 billion of the cash and liquidity was from at-the-market equity offerings in the quarter.
The trade off is dilution. Management anticipates negative free cash flow will remain elevated in Q3 as it funds Neutron and enhances production, thus investors are financing the build of the business with an increasing share count.
The Iridium Deal Changes the Risk Profile
The $8 billion Iridium acquisition, with an expected exchange ratio of $27 cash plus Rocket Lab stock, most captures my attention. The exchange ratio is subject to a collar of $67.50 to $112.50 per share.
If we use the middle of the collar, then Rocket Lab is trading at about a 39% discount to that $90 midpoint, and below the $67.50 floor. The press release didn’t state how the ratio works outside of the collar, therefore, the actual effect will depend on the terms of the merger agreement.
The bigger question is, how will Rocket Lab finance the acquisition? Rocket Lab has a $3.6 billion, 364 day bridge loan with Deutsche Bank and Wells Fargo. The cash portion is funded by cash from the banks, as well as new equity and debt, and cash from the balance sheet. The deal is subject to Iridium shareholder and regulatory approval, and closing is expected in mid-2027.
Analysts Are Trimming, Not Abandoning
KeyBanc lowered its target price to $100 from $135 and kept an Overweight rating. Clear Street lowered its target price to $105 from $129 and kept a Buy rating.
Rocket Lab Technical Analysis: RKLB Tests $55.86 Support as Trendline Break Pushes RSI Oversold
RKLB closed at $55.25, down 6.64%, after gapping lower and hitting an intraday low of $49.69. On my daily chart, the bear trend continued to break the long-term ascending trendline from 2025, and pushed price below the $55.86 to $55.99 swing low. The sharp intraday bounce from the lows shows buyers defending demand between $53 and $56. However, the price is significantly below the $70.33 and $74.93 averages, with the $70.33 average below the $74.93 average, indicating a long-term bearish trend.
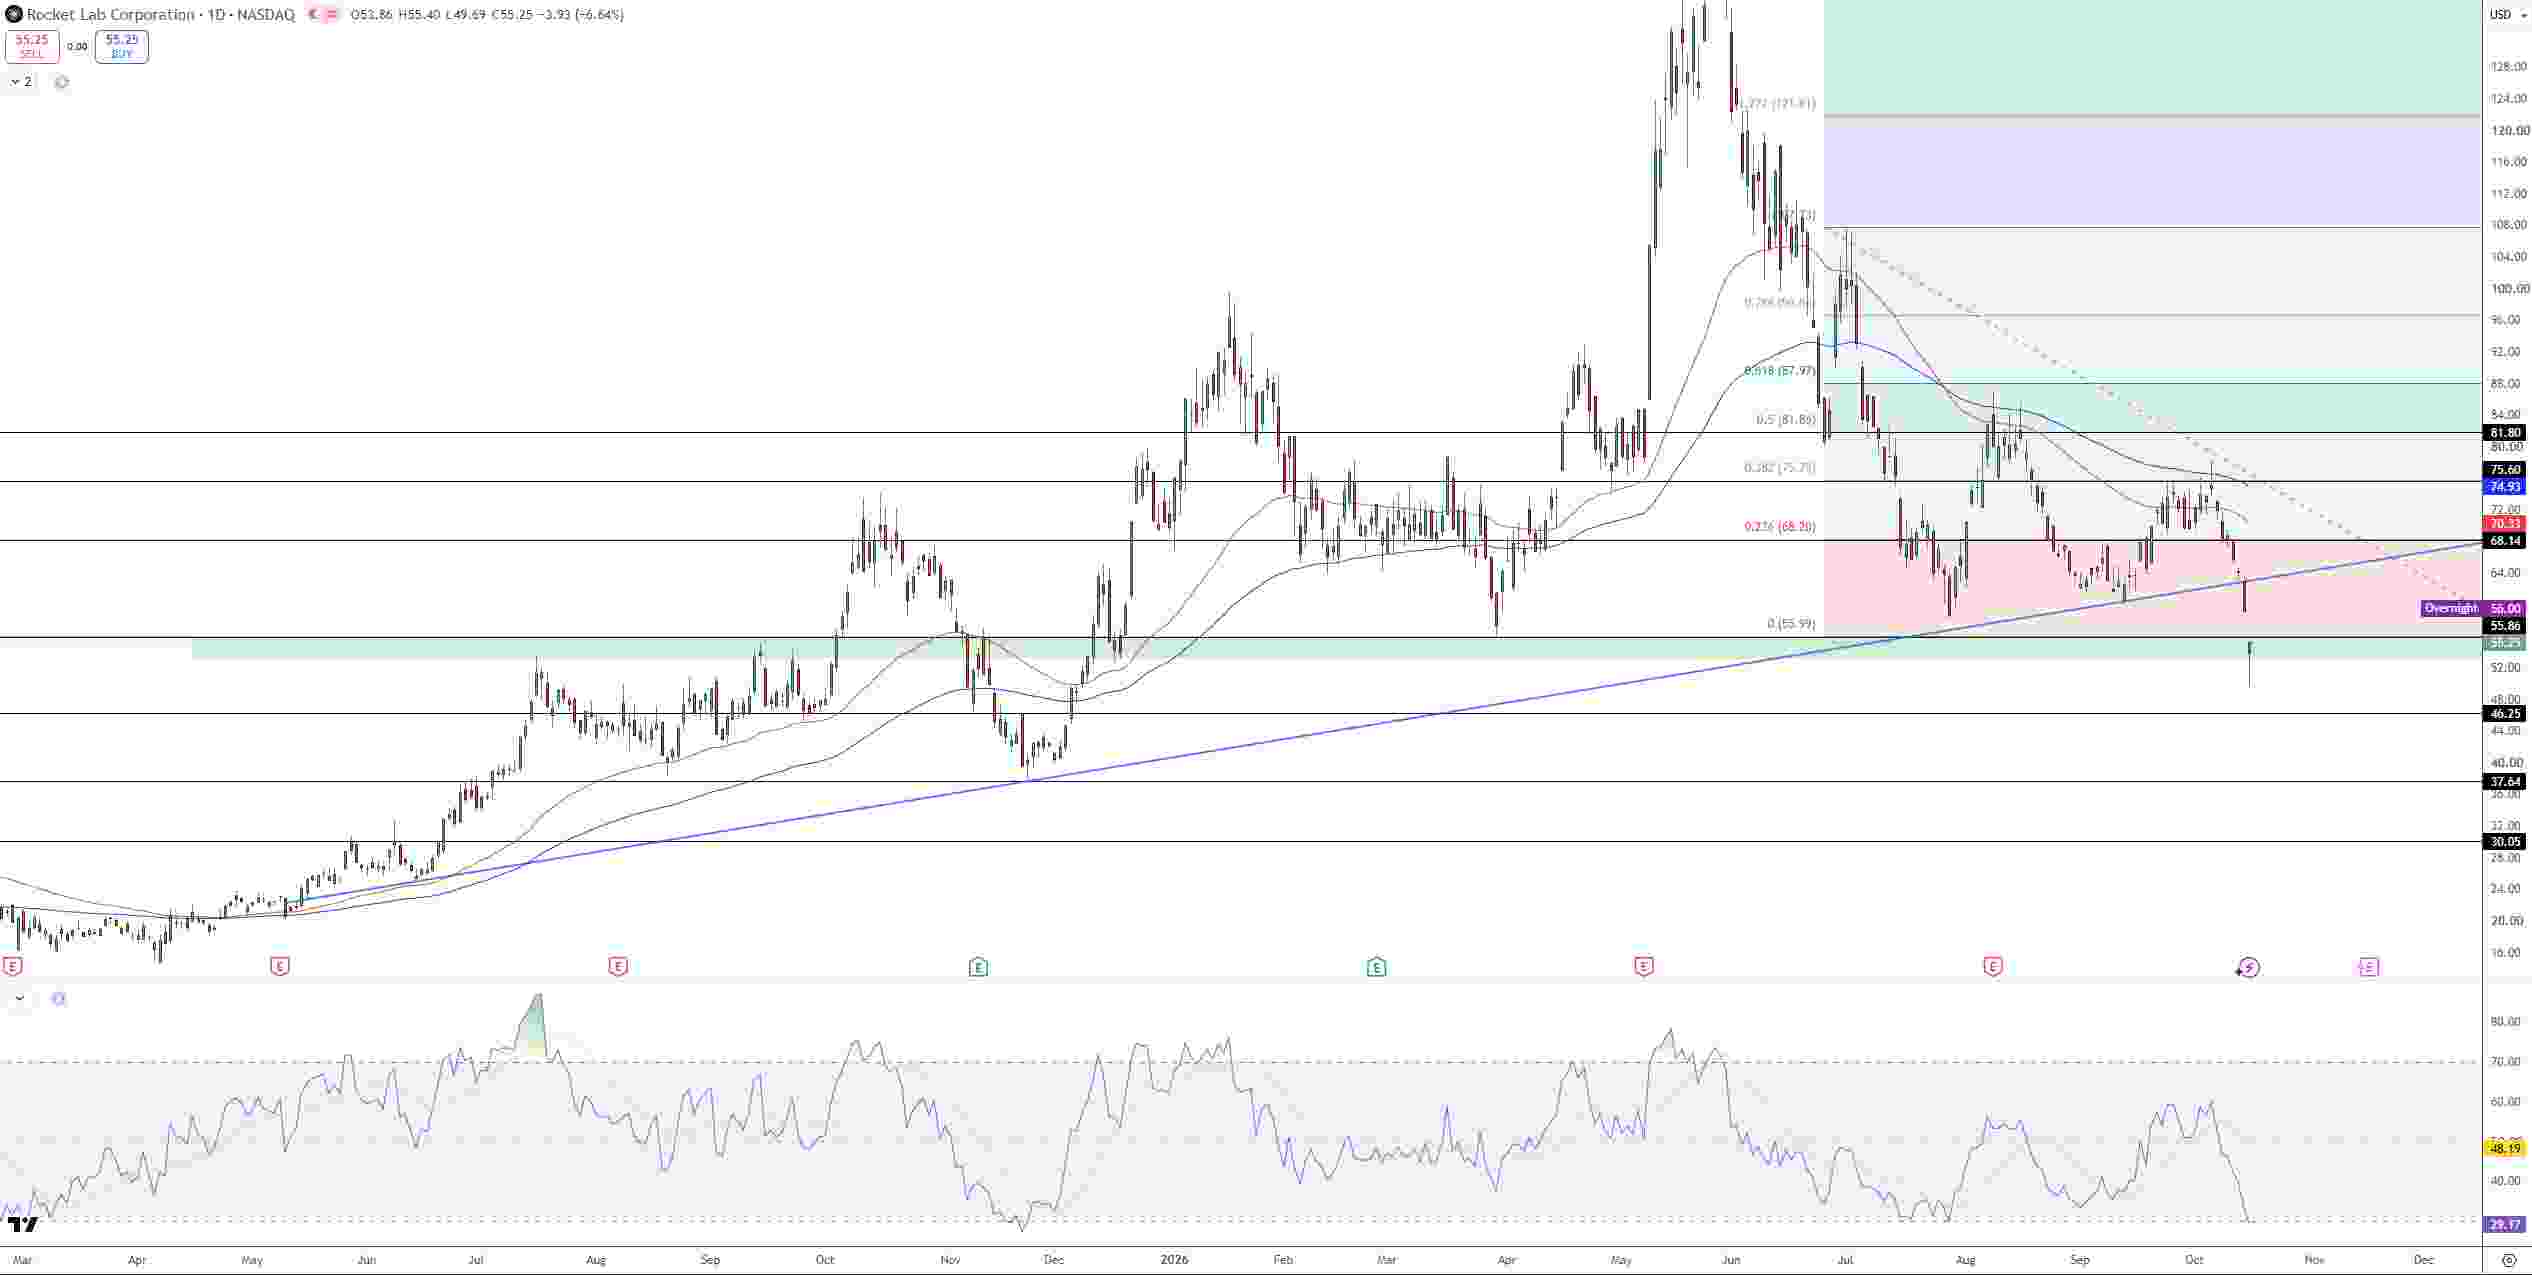
Rocket Lab Stock Price Chart - Source: Tradingview
The RSI dropped to 29.17, below its 48.19 signal line and in oversold territory. Readings this stretched often lead to short term relief rallies. The immediate resistance lies between $55.86 and $55.99. A daily close above it opens the 23.6% Fib at $68.20 at $68.14, $70.33, and $75.60. A daily close below $53 confirms a breakdown towards $46.25 and $37.64. I am bearish below $68.14. However, the oversold condition could lead to a countertrend rally first.
Key Levels
Last close: $55.25, down 6.64% on October 15
Support: $53 to $55.86, $46.25, $37.64
Resistance: $55.86 to $55.99, $68.14, $70.33, $75.60
RSI: 29, below its 48.19 signal line
Bullish trigger: Daily close above $68.14
Bearish trigger: Daily close below $53
FAQs
Why did Rocket Lab stock fall on October 15?
Rocket Lab said the first launch of Neutron has been moved from the end of 2026 to 2027. They mentioned some process improvements in Neutron's manufacturing. The stock fell as much as 16% and eventually closed down 6.64%.
What is the Rocket Lab stock forecast after the Neutron delay?
The bias is bearish under $68.14. Oversold readings could lead to a minor rebound, but a close under $53 would lead to $46.25 and $37.64.
Bottom Line
Rocket Lab’s record revenue and backlog can not make up for the slip of Neutron and an $8 billion acquisition that needs a lot of financing. There is an oversold rebound opportunity if Q3 gives an exact Neutron date and stable margins. A close over $68.14 would improve the outlook, and a close under $53 would confirm the downside.
Recommended Articles


