


History Says a Stock Market Sell-Off Is Coming Eventually. Here's the Smartest ETF to Buy Right Now.
Key Points
There are some indications that stocks are overvalued right now. That could tempt some investors to sell.
History shows investors can typically earn higher returns by keeping their money in the S&P 500 through turbulent times.
The Vanguard S&P 500 ETF is one of the smartest places to put your money for long-term investing.
- These 10 stocks could mint the next wave of millionaires ›
It's been a very good time to invest in the stock market. The current bull market run is well underway, with the S&P 500 (SNPINDEX: ^GSPC) up 78%, the Nasdaq Composite (NASDAQINDEX: ^IXIC) surging 99%, and the Dow Jones Industrial Average (DJINDICES: ^DJI) rising 53% higher over the past three years.
Despite these impressive gains, there is at least one indicator that not everything is well. One particularly worrying sign is that the Shiller cyclically adjusted price-to-earnings (CAPE) ratio has risen very quickly, signaling that stocks are overvalued.
Missed AI’s "Act 1"? Act 2 Could Be 15x Bigger. Most investors think they missed the AI boat because they didn't buy Nvidia in 2005. But according to our analysts, we’re only at the end of "Act 1"—the R&D phase. "Act 2" is the global rollout. Continue »
Here's why it's worth keeping an eye on the CAPE ratio and how you can prepare for market instability by focusing on a long-term investment strategy, like owning the Vanguard S&P 500 ETF (NYSEMKT: VOO).

Image source: Getty Images.
History says stocks are overvalued
The CAPE ratio compares current stock prices to 10 years of inflation-adjusted earnings. The benefit of using this metric is that it helps investors assess whether stocks are overvalued.
The current CAPE ratio of nearly 41 is far above the historic average of 17.8, indicating that stocks are approaching values not seen since the dot-com bubble burst.
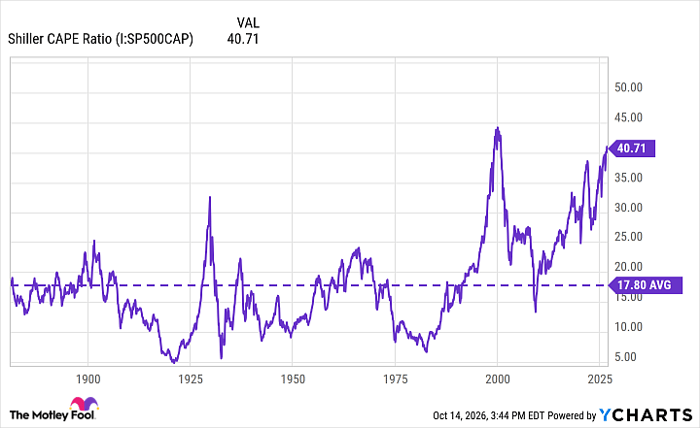
Data by YCharts.
No one knows when a bear market will show up, of course, and one financial metric can't perfectly predict a market sell-off. But there are other warning signs, including that most of the market's recent gains are concentrated in artificial intelligence stocks.
This concentration of returns becomes apparent when you consider that while the S&P 500 is up 17% over the past year, four in 10 stocks in the index have actually declined this year.
Stay focused on long-term investing with one great ETF
So, how can you prepare for a market downturn? One of the best ways to stay the course is to own the Vanguard S&P 500 ETF.
The fund helps you diversify your investments across all market sectors, including technology, energy, industrials, consumer goods, and more.
Owning this Vanguard fund will help you benefit from the 10.5% average annual historical gains of the S&P 500, which the market has returned since 1957. There's no guarantee you'll earn this much, of course, but the long track record of success is a good indicator that owning the fund will help you tap into bull markets whenever they come.
Contrary to what it may feel like when stocks are declining, the best thing you can do is stay invested and maintain a long-term mindset.
That's because keeping your money invested during a bear market can help you earn more money. Research from J.P. Morgan based on 20 years of market data shows that staying invested in the S&P 500 during downturns yields higher returns.
The investment bank found that 7 of the 10 best days in the market came within two weeks of the 10 worst days. For investors who stayed in the market and benefited from those best days, total returns were more than double those who missed out on the best days over the two decades.
The important part to remember is to stay the course, even during a bear market. Do that, and you won't miss the market's best days -- or the S&P 500's tendency to deliver impressive historic gains.
Missed Nvidia in 2009? This Rare Signal Is Flashing Again
In 2009, a "Double Down" signal flashed for a little-known chipmaker called Nvidia. If you’d invested $5,000 then, you’d be sitting on $2,876,672 today.*
Now, for the first time in years, that same "Total Conviction" signal is flashing for a company 1/100th the size of Nvidia. It’s a key player in the $1.8 trillion space race, and with the stock recently sitting 20% off its highs, the window to get in early is closing fast.
Continue »
*Stock Advisor returns as of October 16, 2026.
JPMorgan Chase is an advertising partner of Motley Fool Money. Chris Neiger has positions in Vanguard S&P 500 ETF. The Motley Fool has positions in and recommends JPMorgan Chase and Vanguard S&P 500 ETF. The Motley Fool has a disclosure policy.
Recommended Articles


