

Australian Dollar holds above 0.70 as RBA hike becomes a done deal

Source Fxstreet
  • AUD/USD slips as fading Iran hopes sour global risk appetite.
  • Markets fully price 25-basis-point RBA hike to 4.85%.
  • Australian inflation, trade data follow before key US releases.

The Aussie Dollar dives 0.10% versus the US Dollar as market sentiment deteriorates amid fading US-Iran peace hopes, pushing US bond yields higher while US equity markets fall. Also, price action remained subdued, ahead of the Reserve Bank of Australia (RBA) monetary policy decision. The AUD/USD trades at 0.7016.

AUD/USD stays subdued as geopolitical risks collide with fully priced tightening

A scarce economic docket in the US revealed that the Dallas Fed manufacturing index fell 1.8 points to 9.8 in September but remained above its long-term average of 0.3.  Geopolitical developments and Fed speaking dominated the news headlines.

Fed Governor Lisa Cook said she expects inflationary pressures to build in the coming months, driven by AI and the US-Iran conflict. She acknowledged that the jobs market is well-positioned to handle a cycle of rate increases aimed at tackling inflation.

In Australia, the RBA is expected to raise rates 25 basis points from 4.60% to 4.85%, which would be the highest level since 2008. ANZ analysts expect a split vote, mostly based on “the timing and the apparent preference.”

Money markets are pricing in a 100% chance for a hike by the RBA on September 29, revealed Prime Terminal data.
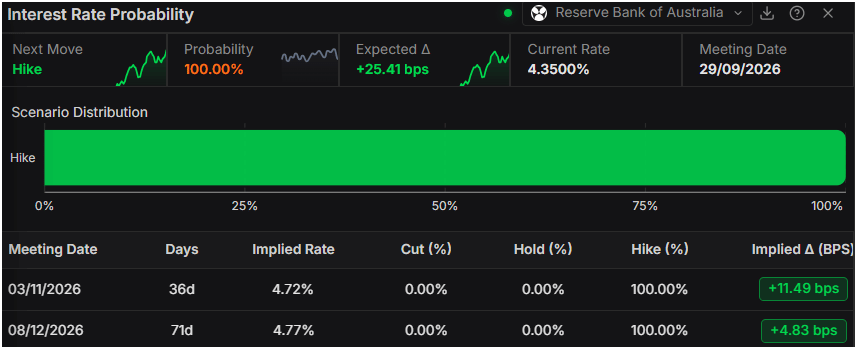
RBA Interest rate probabilities - Source: Prime Terminal

After the RBA’s decision, traders are eyeing the release of Australia's inflation data and the August Trade Balance. In the US, investors await the jobs data, the release of the Fed’s preferred inflation gauge, Core PCE, and September’s Nonfarm Payrolls report.

AUD/USD Price Forecast: Technical Outlook

Chart Analysis AUD/USD
AUD/USD daily chart

In the daily chart, AUD/USD trades at 0.7017, keeping a bearish near-term tone as it slips back under the clustered 100-day and 50-day simple moving averages (SMAs), which now cap the pair around 0.7044 and 0.7093 respectively. The 200-day SMA at 0.6993 acts as underlying trend support, but the Relative Strength Index (14) near 34 suggests persistent downside pressure with the pair edging toward oversold territory rather than staging a decisive recovery.

On the topside, initial resistance is seen at the 100-day SMA around 0.7044, followed by the 50-day SMA near 0.7093, while a horizontal barrier at 0.7198 and the broader downward trend line define a heavier supply zone higher up. On the downside, immediate support aligns with the 200-day SMA close to 0.6993, with a series of rising trend lines from the 0.6865–0.6833 origins offering additional structural demand on deeper pullbacks.

(The technical analysis of this story was written with the help of an AI tool. Know more.)

Australian Dollar Price This Month

The table below shows the percentage change of Australian Dollar (AUD) against listed major currencies this month. Australian Dollar was the strongest against the New Zealand Dollar.

USD EUR GBP JPY CAD AUD NZD CHF
USD 2.17% 2.23% -1.45% 2.32% 2.13% 4.44% 2.90%
EUR -2.17% 0.08% -3.54% 0.14% -0.03% 2.22% 0.72%
GBP -2.23% -0.08% -3.63% 0.07% -0.12% 2.15% 0.67%
JPY 1.45% 3.54% 3.63% 3.81% 3.64% 5.91% 4.48%
CAD -2.32% -0.14% -0.07% -3.81% -0.16% 2.02% 0.58%
AUD -2.13% 0.03% 0.12% -3.64% 0.16% 2.26% 0.78%
NZD -4.44% -2.22% -2.15% -5.91% -2.02% -2.26% -1.48%
CHF -2.90% -0.72% -0.67% -4.48% -0.58% -0.78% 1.48%

The heat map shows percentage changes of major currencies against each other. The base currency is picked from the left column, while the quote currency is picked from the top row. For example, if you pick the Australian Dollar from the left column and move along the horizontal line to the US Dollar, the percentage change displayed in the box will represent AUD (base)/USD (quote).

Disclaimer: For information purposes only. Past performance is not indicative of future results.
placeholder
Gold ends three-week slide at the $4,400 line — eight straight days of ETF inflows vs a 5% 10-year and a 100 dollarSpot gold closed Friday at $4,378.39, up 0.84% on the day and about 0.8% for the week — its first weekly gain in four weeks — with the intraday high of $4,399.67 leaving it 33 cents shy of the $4,400 line. Gold ETFs have now logged eight straight sessions of inflows, but with the 10-year back above 5% and the dollar index near 100, here is what decides whether this is a reversal or a bounce.
Author  Suzie
Sep 20, Sun
Spot gold closed Friday at $4,378.39, up 0.84% on the day and about 0.8% for the week — its first weekly gain in four weeks — with the intraday high of $4,399.67 leaving it 33 cents shy of the $4,400 line. Gold ETFs have now logged eight straight sessions of inflows, but with the 10-year back above 5% and the dollar index near 100, here is what decides whether this is a reversal or a bounce.
placeholder
October hike odds climb toward 60% as Goldman and BofA both flip — what Warsh's "dose of accommodation" really changedRate futures now price roughly 55% to 62% for a 25bp hike at the October 27-28 FOMC, up from about 30% before Chair Warsh's post-meeting framing that the Fed is merely "removing some accommodation." Goldman Sachs has added an October hike to its forecast and Bank of America now sees moves in both October and December. Here is the repricing, the language behind it, and the two data points that decide it.
Author  Irene Q.
Sep 23, Wed
Rate futures now price roughly 55% to 62% for a 25bp hike at the October 27-28 FOMC, up from about 30% before Chair Warsh's post-meeting framing that the Fed is merely "removing some accommodation." Goldman Sachs has added an October hike to its forecast and Bank of America now sees moves in both October and December. Here is the repricing, the language behind it, and the two data points that decide it.
placeholder
Four jobs reports in five days: what JOLTS, ADP, claims and the September payrolls mean for the October Fed decisionThe US labour market faces its densest data week of the month. JOLTS job openings land Tuesday (7.2 million expected), ADP on Wednesday (70,000 expected), initial claims on Thursday and the September non-farm payrolls on Friday (100,000 expected, down from 162,000). Markets price a 64%-70% chance of another quarter-point Fed hike on October 28. The dollar index sits at 100.77 and the S&P 500 at 7,729.8.
Author  Mitrade
Yesterday 06: 33
The US labour market faces its densest data week of the month. JOLTS job openings land Tuesday (7.2 million expected), ADP on Wednesday (70,000 expected), initial claims on Thursday and the September non-farm payrolls on Friday (100,000 expected, down from 162,000). Markets price a 64%-70% chance of another quarter-point Fed hike on October 28. The dollar index sits at 100.77 and the S&P 500 at 7,729.8.
placeholder
RBA set to hike interest rate to 4.60% in September as inflation remains elevatedThe Reserve Bank of Australia (RBA) is widely expected to raise the Official Cash Rate (OCR) by 25 basis points (bps) to 4.60% from 4.35% on Tuesday, after keeping rates unchanged at its previous two meetings
Author  FXStreet
9 hours ago
The Reserve Bank of Australia (RBA) is widely expected to raise the Official Cash Rate (OCR) by 25 basis points (bps) to 4.60% from 4.35% on Tuesday, after keeping rates unchanged at its previous two meetings
placeholder
Nvidia's $150 billion buyback landed — and the AI sector fell anyway. That's the signal worth tradingNvidia closed up 1.68% at $228.86 on 28 September after announcing a $150 billion share repurchase authorisation, the largest single corporate buyback on record, while the rest of the AI complex sold off: AMD -3.6%, Micron -2.6%, Meta -4.8% and the Philadelphia Semiconductor Index -1.61%. The divergence is not noise. Capital is rotating toward cash-flow certainty, not abandoning the AI theme. With Micron reporting after the close on 30 September, here is what the split means.
Author  Irene Q.
4 hours ago
Nvidia closed up 1.68% at $228.86 on 28 September after announcing a $150 billion share repurchase authorisation, the largest single corporate buyback on record, while the rest of the AI complex sold off: AMD -3.6%, Micron -2.6%, Meta -4.8% and the Philadelphia Semiconductor Index -1.61%. The divergence is not noise. Capital is rotating toward cash-flow certainty, not abandoning the AI theme. With Micron reporting after the close on 30 September, here is what the split means.
Related Instrument
goTop
quote