


Banco Santander SA Stock (SAN) Opened Down by 4.05% on Oct 26: What Signal Does It Send?
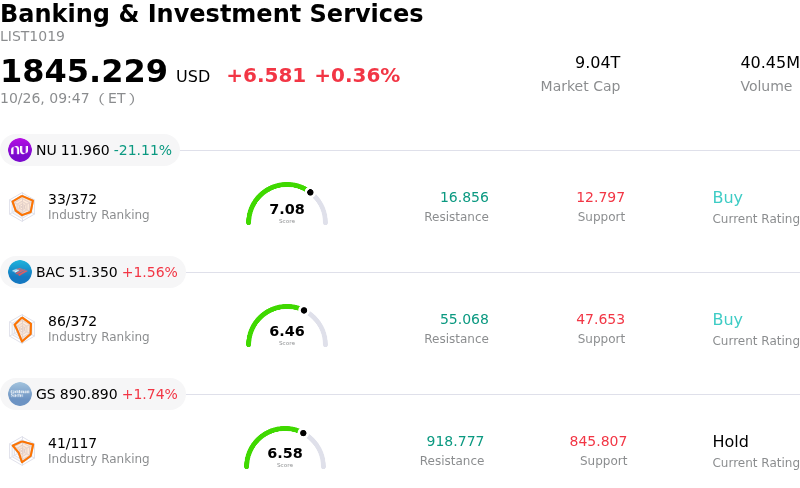
Banco Santander SA (SAN) opened down by 4.05%. The Banking & Investment Services sector is up by 0.36%. The company underperformed the industry. Top 3 stocks by turnover in the sector: Nu Holdings Ltd (NU) down 20.81%; Bank of America Corp (BAC) up 1.63%; Goldman Sachs Group Inc (GS) up 1.74%.
What is driving Banco Santander SA (SAN)’s stock price down today?
Banco Santander experienced notable downward pressure and heightened intraday trading volatility following unexpected political developments in South America. The primary catalyst stems from the outcome of Brazil's presidential runoff election, where leftist candidate Luiz Inacio Lula da Silva secured a victory over market-favored contender Flavio Bolsonaro. Because Brazil represents Banco Santander's second-largest geographic earnings contributor, accounting for roughly fifteen percent of group profits, the political shift introduced sudden policy and economic uncertainty for the region's financial sector. Investors reacted by quickly re-pricing assets exposed to Brazilian credit markets, domestic interest rate shifts, and potential fiscal adjustments, triggering a selloff across Latin American-exposed financial institutions.
The macroeconomic headwind from Brazil was compounded by shifting sell-side sentiment and calendar-driven repositioning. Wall Street coverage updates, including a rating downgrade from Jefferies to a neutral stance, reflected heightened caution regarding growth momentum and election-related risks in South America. Furthermore, the timing of the market volatility coincides with Banco Santander's scheduled nine-month and third-quarter financial results set for release later in the week. Market participants frequently trim positions ahead of earnings releases to manage downside risk, particularly when key regional markets undergo political transitions that could cloud future net interest income and asset quality guidance.
While general U.S. equity markets displayed relative stability, sector-specific risk aversion surrounding international banking groups amplified the session's volatility. Currency translation pressures from emerging market movements against the U.S. dollar added an extra layer of drag on American Depositary Receipts. Moving forward, market participants will focus heavily on executive management's strategic commentary during the upcoming earnings call to assess credit quality trends, regional capital allocation, and the overall resilience of the bank's international diversification strategy.
Technical Analysis of Banco Santander SA (SAN)
Technically, Banco Santander SA (SAN) shows a MACD (12,26,9) value of -0.151, indicating a sell signal. The RSI at 27.850 suggests sell condition and the Williams %R at 98.258 suggests oversold condition. Please monitor closely.
Fundamental Analysis of Banco Santander SA (SAN)
Banco Santander SA (SAN) is in the Banking & Investment Services industry. Its latest annual revenue is $65.95B, ranking 5 in the industry. The net profit is $15.90B, ranking 5 in the industry. Company Profile
Over the past month, multiple analysts have rated the company as Buy, with an average price target of $14.76, a high of $15.70, and a low of $13.82.
More details about Banco Santander SA (SAN)
Company Specific Risks:
- Institutional Downgrade Pressure: Jefferies Financial Group downgraded Banco Santander from a "buy" rating to a "hold" rating, eroding institutional sentiment and triggering downward momentum ahead of key corporate reporting.
- Emerging Market Political and Credit Volatility: Heightened political and economic shifts in Brazil present severe headwind risks, as Brazilian operations generate approximately 15% of the bank's total profits, leaving Santander acutely exposed to South American credit risk and local interest rate swings.
- Earnings Anxiety and Previous Earnings Miss: Market uncertainty is elevated ahead of the bank's scheduled nine-month financial results on October 28, 2026, driven by caution following a previous quarterly earnings per share miss ($0.27 vs. $0.29 expected) and fears of net interest margin compression.
- Litigation Over Private Credit Exposure: Ongoing investor class action lawsuits and legal investigations alleging misleading disclosures regarding potential credit losses linked to the collapse of UK mortgage provider Market Financial Solutions Ltd present persistent regulatory and financial overhangs.
Recommended Articles


