

XRP (XRPUSD) Volatility Intensified on Oct 15: What You Should Know

Source Tradingkey

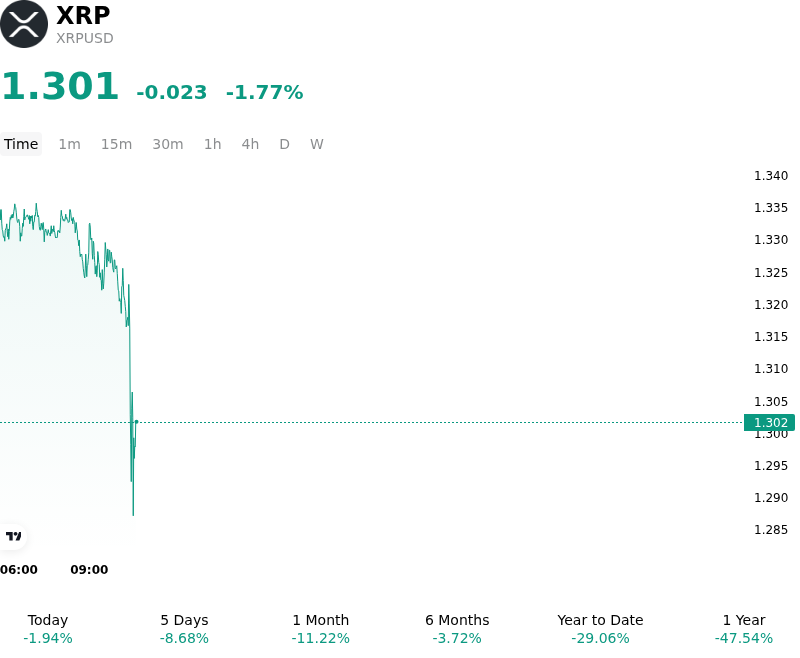
XRP (XRPUSD) is down 1.77% at Oct 15 22:35(ET), now at $1.3012, with a 7-day down of 5.56%.
SummaryOverview

What is driving XRP (XRPUSD)’s stock price down today?

The pull-back in XRP was primarily driven by broader risk reduction across digital asset markets, as macroeconomic headwinds and persistent monetary policy expectations weighed on risk appetite. With financial markets recalibrating expectations around Federal Reserve interest rate policy and US Treasury yields remaining elevated, non-yielding crypto assets faced structural valuation pressure. Capital flows across digital asset markets turned defensive ahead of key US inflation data releases, dampening risk budgets for institutional allocators.

Compounding the macro drag, institutional accumulation through spot XRP exchange-traded funds showed signs of temporary deceleration. Following periods of steady inflows, net fund creations slowed, leaving spot market order books with diminished buy-side depth. Without robust net inflows into exchange-traded products to anchor valuations, spot markets lacked sufficient liquidity to absorb persistent selling pressure.

The downside movement was further amplified by structural de-leveraging across crypto derivatives venues. Elevated open interest and leveraged long positions were subject to long liquidations as price action broke through immediate technical support levels. This forced unwind of futures contracts accelerated intraday downside momentum, reducing open interest and reflecting a clear shift toward risk reduction across trading venues.

From an ecosystem perspective, recent announcements—including institutional custody partnerships and wallet infrastructure integrations on the XRP Ledger—resulted in a sell-the-news response rather than immediate spot buying. Traders utilized the liquidity surrounding positive infrastructure headlines to lock in gains and de-risk. Over the medium term, institutional investors continue to monitor whether spot ETF flow velocity resumes and whether expanding network usage translates into sustained structural demand for the underlying token.

Technical Analysis of XRP (XRPUSD)

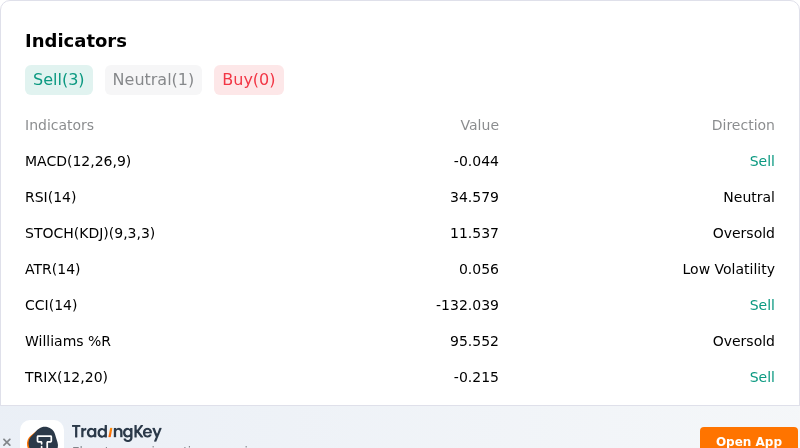
Technically, XRP (XRPUSD) shows a MACD (12,26,9) value of -0.044, indicating a sell signal. The RSI at 35.166 suggests neutral condition and the Williams %R at 94.111 suggests oversold condition. Please monitor closely.
IndicatorAnalysis

More details about XRP (XRPUSD)

Recent Events and Risks:

  • Leverage Overhang and Liquidation Cascades: High open interest in perpetual futures and a lopsided long-to-short positioning ratio leave XRP vulnerable to sharp long liquidation flushes, after recent market pullbacks triggered over $600 million in forced unwinds across derivatives venues.
  • Deceleration of Spot ETF Capital Inflows: Institutional net inflows into spot XRP exchange-traded products have slowed significantly compared to earlier expansion phases, leaving spot order books thinner and less capable of absorbing persistent selling pressure.
  • Key Moving Average Breakdown Threat: XRP trading below its converged 50-day and 200-day moving averages near the $1.39–$1.40 threshold increases the risk of triggering concentrated stop-loss clusters and testing lower technical support bounds near $1.31.
  • Macro Risk-Off Volatility Spillovers: Elevated U.S. Treasury yields and global macro uncertainty continue to weigh on risk assets, suppressing spot buying volume and heightening downside contagion across major altcoins.
Disclaimer: For information purposes only. Past performance is not indicative of future results.
placeholder
US September CPI preview: inflation set to hit 3.7% — will the Fed hike in December?US September CPI lands Wednesday with headline inflation seen at 3.7% y/y and core at 0.2% m/m. December hike odds sit near 70% — here are the scenarios, the calendar and the key levels.
Author  Irene Q.
Oct 10, Sat
US September CPI lands Wednesday with headline inflation seen at 3.7% y/y and core at 0.2% m/m. December hike odds sit near 70% — here are the scenarios, the calendar and the key levels.
placeholder
Yen inches toward 159 as Tokyo reopens — where is the line in the sand before 160?USD/JPY traded around 158.5 on Tuesday after Monday's 158.60 close — the highest since September 24 — as Tokyo reopened and the market re-focused on two dates dominating the yen calendar: the G20 finance ministers' meeting in Bangkok on October 15 and the Bank of Japan's October 30 decision. Here are the three forces leaning on the yen, the positioning picture, and the scenarios into Wednesday's US CPI.
Author  Irene Q.
Oct 13, Tue
USD/JPY traded around 158.5 on Tuesday after Monday's 158.60 close — the highest since September 24 — as Tokyo reopened and the market re-focused on two dates dominating the yen calendar: the G20 finance ministers' meeting in Bangkok on October 15 and the Bank of Japan's October 30 decision. Here are the three forces leaning on the yen, the positioning picture, and the scenarios into Wednesday's US CPI.
placeholder
Strong profits, falling shares: bank earnings day one meets a memory-chip rout — with CPI and ASML aheadGoldman Sachs blew past estimates (EPS $17.01 vs $13.09 expected, profit +33%) while JPMorgan missed ($5.75 vs $5.93) and Wells Fargo fell 3% — yet the S&P 500 finished flat at 7,805.45, pinned below its record close as a memory-chip rout (SOX −2.67%, Micron under $1,000) kept the pressure on. Tonight brings the week's decider: US September CPI at 8:30 ET, then Bank of America, Morgan Stanley, BlackRock and ASML before the open. Here are the levels, both cases, and the watch list.
Author  Irene Q.
Yesterday 06: 06
Goldman Sachs blew past estimates (EPS $17.01 vs $13.09 expected, profit +33%) while JPMorgan missed ($5.75 vs $5.93) and Wells Fargo fell 3% — yet the S&P 500 finished flat at 7,805.45, pinned below its record close as a memory-chip rout (SOX −2.67%, Micron under $1,000) kept the pressure on. Tonight brings the week's decider: US September CPI at 8:30 ET, then Bank of America, Morgan Stanley, BlackRock and ASML before the open. Here are the levels, both cases, and the watch list.
placeholder
Bitcoin's V-shaped rebound: from $80,953 back above $83,000 — spot buyers step in as the Fed softens, but ETF outflows lingerBitcoin slid to $80,953 on October 13 — then snapped back above $83,000, reclaiming the 81,847–82,305 'golden zone' on spot-led buying as Williams and Waller cooled the Fed's hawkish tone and the dollar pulled back from its 18-month high. But October ETF outflows near $386 million and a fear-and-greed reading of 56 say the repair is unfinished. Here are the levels, the transmission chain and both cases ahead of tonight's US CPI.
Author  Suzie
Yesterday 06: 36
Bitcoin slid to $80,953 on October 13 — then snapped back above $83,000, reclaiming the 81,847–82,305 'golden zone' on spot-led buying as Williams and Waller cooled the Fed's hawkish tone and the dollar pulled back from its 18-month high. But October ETF outflows near $386 million and a fear-and-greed reading of 56 say the repair is unfinished. Here are the levels, the transmission chain and both cases ahead of tonight's US CPI.
placeholder
Gold Price Analysis Today | Forex Gold Analysis | XAU/USD Analysis - October 14, 2026Get the latest gold price analysis, forex gold insights, and XAU/USD analysis for October 14, 2026. Read on for the details.
Author  Mitrade
Yesterday 07: 11
Get the latest gold price analysis, forex gold insights, and XAU/USD analysis for October 14, 2026. Read on for the details.
goTop
quote