


What Is Market Cap? The Definition Every Investor Needs Before Picking Their First Stock
Key Points
Market cap changes constantly based on stock movements.
Stocks are usually split into several market cap categories.
Indexes and ETFs often specialize in specific market caps.
- 10 stocks we like better than Nvidia ›
If you're analyzing a stock, one of the first metrics that comes up is market cap. That's short for market capitalization, and it's the total value of all of a company's shares outstanding. Here's how it's calculated and why it's important.
What is market cap?
When you hear about the largest companies in the world, it often refers to the most valuable companies in the world, and these phrases are often interchangeable. They both refer to the size of the company's market cap. Nvidia (NASDAQ: NVDA), for example, is the largest company in the world with a market cap of about $5.5 trillion.
Missed Nvidia in 2009? This Rare Signal Is Flashing Again. In 2009, a "Double Down" signal flashed for a little-known chipmaker called Nvidia. For the first time in years, that same "Total Conviction" signal is flashing for a company 1/100th the size of Nvidia. Continue »

Image source: Getty Images.
Market cap is determined by multiplying the price per share by the total shares outstanding. In Nvidia's case, for example, shares are trading at about $229, and there are 24.3 billion shares outstanding.
However, that market cap changes constantly as the price per share rises or falls, and it could change drastically if a stock makes a big movement in either direction. The status of the most valuable company in the world has shifted among Nvidia, Apple, and Microsoft during the past few years, as assessed by market cap and shown in the following chart.
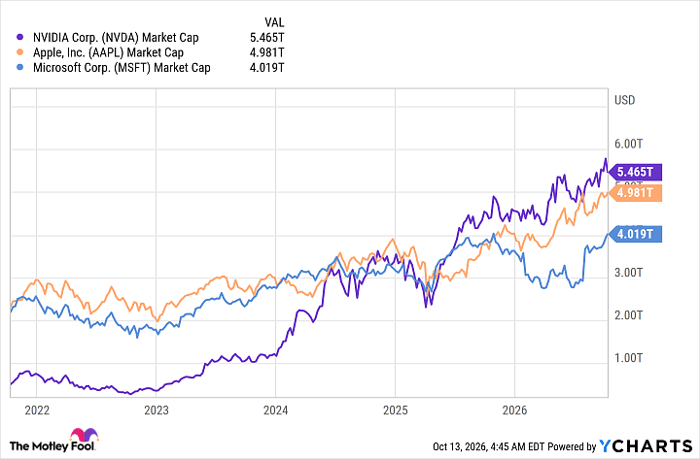
NVDA Market Cap data by YCharts
That's due to their stock gains and losses. A few years ago, Nvidia was a relatively obscure chipmaker, but as an artificial intelligence (AI) giant, its stock and market cap have soared.
Market cap categories
Market cap becomes important for investors when building a diversified portfolio. Stocks are typically categorized by size according to these groups: micro cap, small cap, mid cap, large cap, and mega cap. There are also nano-cap stocks, but they often trade over the counter (OTC) instead of on one of the main stock exchanges. Categories are usually defined by these numbers:
- Micro cap: $50 million to $250 million
- Small cap: $250 million to $2 billion
- Mid cap: $2 billion to $10 billion
- Large cap: $10 billion to $200 billion
- Mega cap: $200 billion and above
A great mix of stocks includes several categories. Micro-cap stocks are often in the development stage and may be risky, but may offer excellent growth. Small-cap stocks are often established enough to be stable and still offer excellent growth opportunities. Mid-cap stocks are typically past their initial growth phase and may be quite successful. Large-cap stocks have already demonstrated consistent growth, which is why they're so valuable, and mega-cap stocks are the industry giants. The mega-cap stocks generally get the most attention, and they often continue to grow rapidly. Many of them also pay a dividend, especially if they're past their high-growth stage.
The large tech stocks fall into the mega-cap category, but it also includes many other dominant companies like Walmart, Eli Lilly, and Visa.
Stock splits
Often, when a stock's price becomes very high, a company will choose to split its stock. That doesn't affect the market cap at all. It just means there are more shares outstanding, and each one is worth less. For example, CrowdStrike split its stock 4-for-1 in July, meaning a holder of one share now holds four shares of lesser value. The stock went from a price of $772.74 to $193.19 when the split took effect on July 2, but the market cap remained the same.
Indexes and ETFs
Many indexes and exchange-traded funds (ETFs) are based on specific market-cap sizes. The S&P 500 has a minimum market cap requirement of $20.5 billion, which means it only includes large- and mega-cap stocks. It reviews its holdings quarterly and will remove stocks that fall below that threshold. That's one of the reasons the index is geared for growth: Slow-growing companies will be replaced with faster-growing ones as necessary. S&P Global also has separate mid-cap and small-cap indexes.
ETFs that track indexes reflect these categories as well, and you can get exposure to different classes by buying ETFs that specialize in them.
Should you buy stock in Nvidia right now?
Before you buy stock in Nvidia, consider this:
The Motley Fool Stock Advisor analyst team just identified what they believe are the 10 best stocks for investors to buy now… and Nvidia wasn’t one of them. The 10 stocks that made the cut could produce monster returns in the coming years.
Consider when Netflix made this list on December 17, 2004... if you invested $1,000 at the time of our recommendation, you’d have $379,986!* Or when Nvidia made this list on April 15, 2005... if you invested $1,000 at the time of our recommendation, you’d have $1,404,152!*
Now, it’s worth noting Stock Advisor’s total average return is 948% — a market-crushing outperformance compared to 215% for the S&P 500. Don't miss the latest top 10 list, available with Stock Advisor, and join an investing community built by individual investors for individual investors.
See the 10 stocks »
*Stock Advisor returns as of October 15, 2026.
Jennifer Saibil has positions in Apple and Walmart. The Motley Fool has positions in and recommends Apple, CrowdStrike, Eli Lilly, Microsoft, Nvidia, S&P Global, Visa, and Walmart. The Motley Fool has a disclosure policy.
Recommended Articles


