


Euro holds recovery move near 1.1220 against US Dollar ahead of US PPI data
- Euro clings to recovery move near 1.1220 against the US Dollar as the latter underperforms.
- The Fed is almost certain to leave interest rates unchanged in the October meeting.
- Investors keenly await Fed Chair Warsh' speech on Friday.
The Euro (EUR) holds onto its recovery move to near 1.1220 against the US Dollar (USD) in the European trade on Thursday. The major currency pair rebounded at the expense of the US Dollar.
In the European trade, the US Dollar Index (DXY), which tracks gauges the Greenback’s value against six major currencies, is down 0.5% to near 102.00.
US Dollar Price Today
The table below shows the percentage change of US Dollar (USD) against listed major currencies today. US Dollar was the weakest against the Swiss Franc.
| USD | EUR | GBP | JPY | CAD | AUD | NZD | CHF | |
|---|---|---|---|---|---|---|---|---|
| USD | -0.52% | -0.50% | -0.32% | -0.24% | 0.61% | -0.31% | -0.61% | |
| EUR | 0.52% | 0.02% | 0.19% | 0.25% | 1.16% | 0.19% | -0.09% | |
| GBP | 0.50% | -0.02% | 0.19% | 0.23% | 1.11% | 0.17% | -0.12% | |
| JPY | 0.32% | -0.19% | -0.19% | 0.04% | 0.93% | -0.03% | -0.31% | |
| CAD | 0.24% | -0.25% | -0.23% | -0.04% | 0.86% | -0.05% | -0.35% | |
| AUD | -0.61% | -1.16% | -1.11% | -0.93% | -0.86% | -0.92% | -1.22% | |
| NZD | 0.31% | -0.19% | -0.17% | 0.03% | 0.05% | 0.92% | -0.31% | |
| CHF | 0.61% | 0.09% | 0.12% | 0.31% | 0.35% | 1.22% | 0.31% |
The heat map shows percentage changes of major currencies against each other. The base currency is picked from the left column, while the quote currency is picked from the top row. For example, if you pick the US Dollar from the left column and move along the horizontal line to the Japanese Yen, the percentage change displayed in the box will represent USD (base)/JPY (quote).
The US Dollar faces selling pressure as hawkish Federal Reserve (Fed) expectations for the October meeting remains lower even after the United States (US) Consumer Price Index (CPI) report for September showing the price pressures grew at a faster-than-expected pace.
What’s next for Fed expectations for October?
Analysts at OCBC highlight that “attention now turns to Kevin Warsh’s fireside chat with IMF Managing Director Kristalina Georgieva on 16 October,” noting that the event is “confirmed on the IMF calendar, while the Fed lists the discussion ahead of its 27-28 October FOMC meeting.” With markets “now assigning meaningful odds to an October hike,” OCBC expects investors to closely monitor the session, as “investors will scrutinise Warsh for any hint that the Fed is leaning toward moving sooner rather than waiting until December.”
Later in the day, investors will focus on the US Producer Price Index (PPI) data for September, which will be published at 12:30 GMT. The headline producer inflation data is seen at 5.3% Year-on-Year (YoY), lower than 5.4% in August. The core PPI – which excludes volatile food and energy items – is also expected to come in lower at 4.4% from the previous reading of 4.6%.
On the Euro front, the Industrial Production data for August has come in weaker-than-expected. The industrial sector activity declined at a faster pace of 0.5% in August. The data was expected to remain flat after contracting 0.3% in July, revised lower from -0.1%.
EUR/USD Technical Analysis
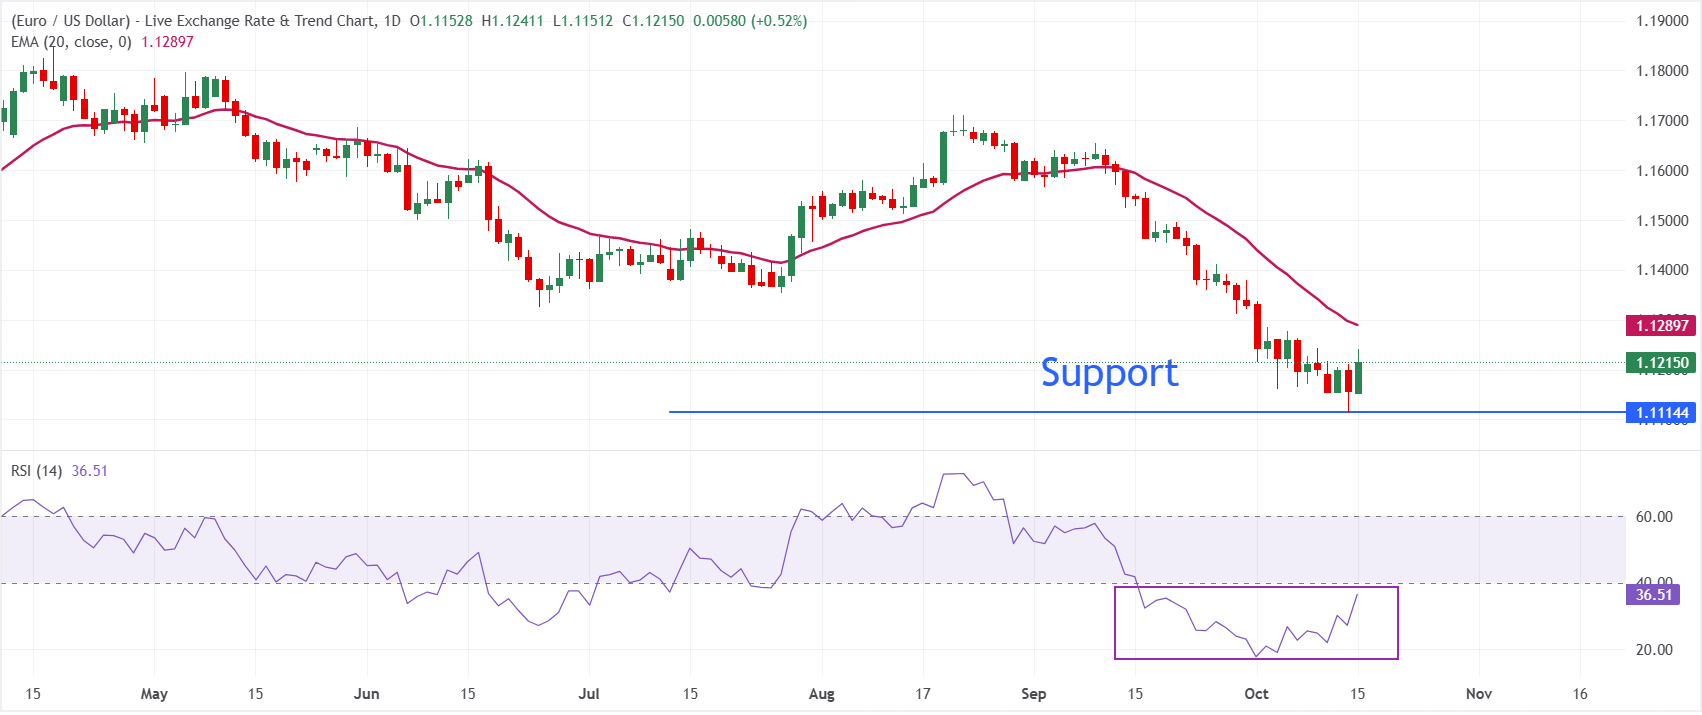
In the daily chart, EUR/USD trades at 1.1215, maintaining a bearish near-term bias as spot remains capped beneath the 20-day Exponential Moving Average (EMA) at 1.1290. The failed attempt to reclaim this short-term trend proxy keeps the pair anchored in a corrective phase, while the Relative Strength Index (RSI) at 36 suggests momentum is recovering from oversold territory but not yet strong enough to challenge the prevailing downside structure.
On the topside, immediate resistance is located at the 20-day EMA at 1.1290, which acts as the first hurdle for any rebound and a key level that bulls would need to reclaim to ease selling pressure. As long as EUR/USD trades below this barrier, rallies are likely to be shallow, and the broader focus would stay on whether price can hold current levels rather than build toward a more sustained recovery.
(The technical analysis of this story was written with the help of an AI tool. Know more.)
Economic Indicator
Fed's Chair Warsh speech
Kevin Warsh took office as chairman of the Board of Governors of the Federal Reserve in May 2026, for a four-year term ending in 2030. His term as a member of the Board of Governors will expire in May 2040. Warsh, born in Albany (New York) on April 13, 1970, is an American financier and attorney who already served as a member of the Fed Board of Governors from 2006 to 2011 and was significantly involved in the central bank's response to the financial crisis.
Read more.Next release: Fri Oct 16, 2026 03:30
Frequency: Irregular
Consensus: -
Previous: -
Source: Federal Reserve
Recommended Articles


