


TSMC Stock Forecast: Record Profit and 2nm Ramp Test $430 Support
TradingKey - Taiwan Semiconductor Manufacturing Co. (NYSE:TSM) fell 3.40% to close at $430.00 on October 14 with the AI sell-off. The October 15 earnings report clarified a stronger fundamental outlook on the company with record profits, increasing advanced-node demand and positive guidance for the fourth quarter.
My near-term outlook sees a stronger operating cycle than share price cycle. The major investment concern is can TSMC increase higher-end capacity without margin erosion?
Q3 Revenue and Profit Set Records
TSMC reported record Q3 revenue of $46.72 billion, up 41.2% from a year earlier and 16.2% from the previous quarter in U.S. dollars. Net income rose 68.7% to NT$763.06 billion (about $23.6 billion), from NT$452.30 billion a year earlier, with diluted EPS of NT$29.43 ($4.60 per ADR), from NT$17.44 ($2.92 per ADR) a year earlier. Revenue increased 50.9% in Taiwan dollars from a year earlier, while U.S. dollar revenue grew by 41.2% from a year earlier. While both measures reflect increasing sales of advanced chips, the two percentages should not be equated.
HPC Reaches 68% of Revenue
In the third quarter of this year, revenue from high-performance computing (HPC) accounted for 68% of total revenue, compared to 66% in the previous quarter and 57% in the same quarter last year. Revenue from HPC increased by 22% from the previous quarter. Revenue from smartphones was 21%, and revenue from automobiles increased by 23% from the previous quarter.
What is worth noting is that more and more AI accelerators and data-center processors are used. TSMC has more ways to reduce its reliance to any single architecture by supplying competing chip designers. HPC also includes non-AI products, so 68% is not a pure AI revenue figure.
2nm Ramp Accelerates to 8% of Wafer Sales
About 8% of third quarter wafer revenue came from the 2nm wafer process, up from 3% the previous quarter. The 3nm wafer process accounted for 33% of wafer revenue, the 5nm process accounted for 28% of wafer revenue, and the 7nm process accounted for 10% of wafer revenue. All processes at 7nm and below accounted for 79% of wafer revenue.
The rapid transition of customers to leading edge processes continues. Even though the wafer process mix is not balanced with total company revenue, the rapid process technology adjustment may positively impact revenue. Offsetting benefits of higher prices may be absorbed by early stage production costs.
Q4 Outlook Signals Another Record
TSMC expects fourth quarter revenue to be between $52.3 billion and $54.3 billion, which would be a about 14% sequential increase at the midpoint. Gross margin is expected to be between 65% and 67%, while operating margin is expected to be between 56.5% and 58.5%.
In the third quarter, gross margin was 66.4%, down from 67.7% in the second quarter, and up from 59.5% a year earlier. Operating margin was 58.7%. Management attributed the sequential decrease in gross margin to ramping 2nm. I will be looking for utilization to improve the cost structure.
60–64 Billion Capex Prioritizes Capacity
TSMC is focusing on advanced packaging and leading-edge wafer capacity and kept its 2026 capex target at $60 - $64 billion. On October 8, GlobalFoundries also announced a multiyear $2 billion contract to supply TSMC with silicon interposers for CoWoS (Chip-on-Wafer-on-Substrate) packaging in New York.
An interposer connects high bandwidth memory processors (HBM) to an AI (artificial intelligence) processor. This contract reduces a supply constraint, but $2 billion is not an incremental sales agreement for TSMC. GlobalFoundries will manufacture silicon interposers for TSMC under the multiyear agreement; it does not guarantee $2 billion of TSMC revenue.
Arizona Expansion Adds Geographic Diversification
The July expansion of TSMC's Arizona facility increased the total estimated investment to $265 billion. From a supply chain perspective, locating fab capacity near customers, like in the U.S., makes sense; however, there are higher costs to build and operate fabs outside the U.S.
I am constructive on the expansion only if the returns are adequate. Given potential U.S. sites, I view these as speculative projects until confirmed investment and time schedules are finalized.
2027 Caution Meets AI Financing Risks
TSMC CEO, C.C. Wei, is still cautious about 2027 due to the uncertainty in macroeconomic conditions, including component costs in price-sensitive markets.
Debt concerns among data center operators and the decline of TSMC's and other semiconductor manufacturer's shares, report obligations concerning client wafer demand. TSMC is not a highly leveraged AI cloud operator, but decreased client capital expenditure could impact wafer demand.
Next Catalyst: Q4 Execution and 2nm Utilization
My focus is the company's goal to generate $52.3 billion - $54.3 billion in sales in Q4, 2nm shipments, gross margin, and CoWoS (Chip-on-Wafer-on-Substrate) supply. I am looking for margin stabilization, and utilization strengthening the case; lower orders and/or cost overruns would weaken it.
The ADR closing price on October 14 was approximately 10.8% lower from the October 6 close of $482.30. This recent pullback reflects a more acute valuation reset than what the recently reported Q3 results warrant. However, this doesn't confirm it is a good value opportunity.
TSMC Technical Analysis: $430 Support Faces Breakdown Risk
TSMC closed the session at $430 on October 14, a loss of 3.40% from the previous day. It traded between $428.06 (the day's low) and $440.39 (the day's high), closing at $430, with the low holding above the support line of $427.65. The stock is still below the resistance area of 438.44-440.73, which was tested on the upside after it broke the rising support trend line.
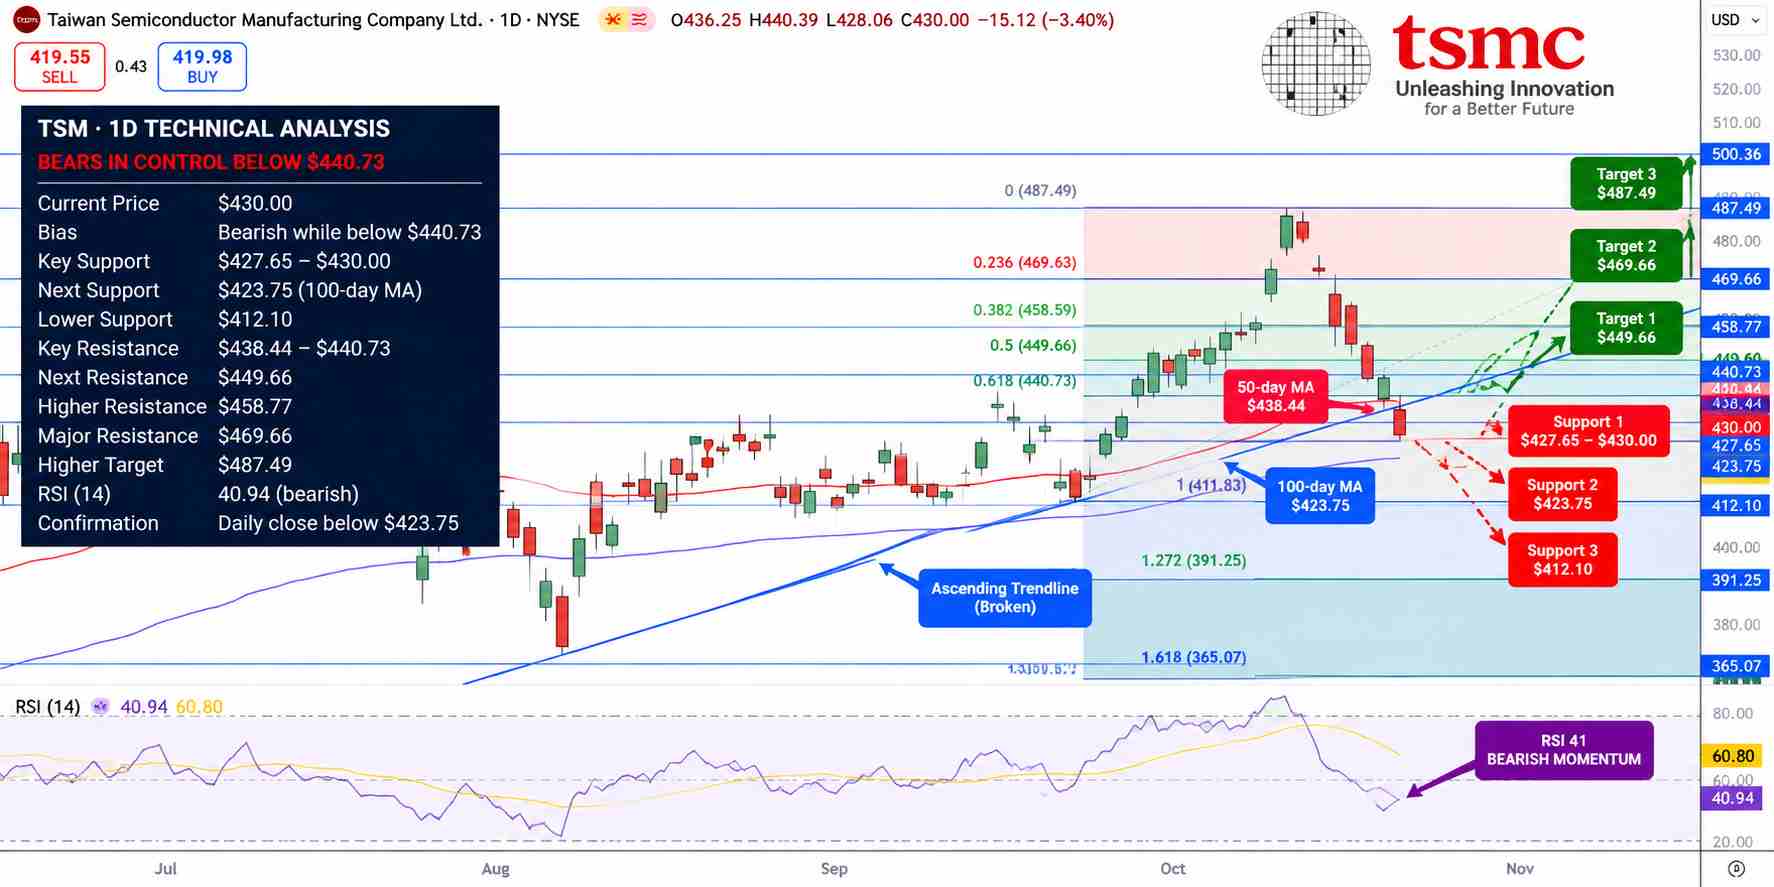
TSMC Price Chart - Source: Tradingview
RSI is shown near 41, below a signal line at 61, with the 50-day moving average at $438.44. These levels and trendlines are chart-derived, not validated. The RSI is trending down, which may indicate bearish momentum, but it is not yet in oversold territory.
Given this, I think there is a risk that the stock may again break lower to test the chart-derived supports of $427.65 and then $423.75, which leads to other supports at $412.10 and possibly $391.25. Breaking above the resistance area at 438.44-440.73 would bring the resistance levels at $449.66 and $458.77 in play, and possibly $469.66. I would wait for closing-price confirmation on trades to avoid getting trapped in an trending stock. Since the stock is already trading near support, the next closing price of TSMC is going to be more important than an intraday bounce.
Key Levels
- Latest Close: $430.00, October 14, -3.40%
- Support: $427.65 and $423.75, then $412.10 and $391.25
- Resistance: $438.44 to $440.73, then $449.66 and $458.77
- RSI: approximately 41 (not independently verified)
- Breakout trigger: close above $440.73
- Breakdown trigger: close below $423.75
FAQ: Why Does TSMC's 2nm Ramp Matter?
TSMC's latest process demonstrated strong customer interest and increased wafer revenue from 3% to 8% in one quarter.
FAQ: What Is TSM Stock's Main Breakdown Level?
As shown on the supplied chart, $427.65 provides support. A confirmed close below $423.75 would bring $412.10 into focus.
Bottom Line
TSMC has positive catalysts in AI and 2nm, but the costs of building capacity and global financing for AI remain risks. I see a short term pause and lower bias below $440.73.
Recommended Articles


