


Bitcoin (BTCUSD) Volatility Intensified on Oct 14: What You Should Know
Bitcoin (BTCUSD) is down 1.21% at Oct 14 09:20(ET), now at $82380.12, with a 7-day down of 1.23%.
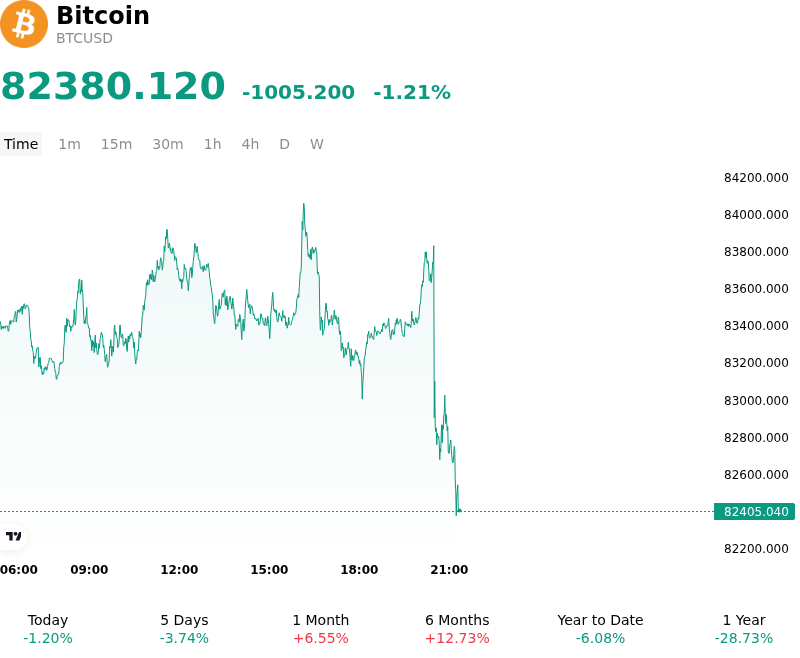
What is driving Bitcoin (BTCUSD)’s stock price down today?
Bitcoin experienced downward pressure as crypto asset markets digested macroeconomic uncertainty ahead of key U.S. inflation data. Institutional investors trimmed exposure as market participants evaluated potential monetary policy trajectories leading into the Federal Reserve's upcoming policy decision. Elevated U.S. Treasury yields and a firm U.S. dollar continued to tighten broader financial conditions, diminishing risk appetite across digital asset venues and creating headwinds for non-yielding assets.
Spot ETF liquidity dynamics played a significant role in weakening capital inflows. Regulated U.S. spot Bitcoin exchange-traded funds recorded persistent volatility and net outflows over recent trading sessions, signaling a pause in institutional accumulation. The lack of sustained buying interest from institutional asset managers left spot order books vulnerable to sell-side pressure, with major exchange order books demonstrating an imbalance favoring sell-side supply near key overhead resistance levels.
Derivatives market positioning further amplified the pullback. Short-term speculative traders faced repeated rejections at local resistance barriers, triggering localized long liquidations and a softening of futures funding rates across perpetual markets. The lack of a decisive catalyst encouraged profit-taking among short-term holders, while on-chain activity indicated moderate transaction volumes characteristic of a market operating in a tactical consolidation phase.
From a structural perspective, the pullback reflects a short-term macro liquidity repricing rather than a systemic trend reversal. Institutional allocators continue to monitor sovereign yield trajectories, spot ETF flow stability, and Federal Reserve messaging for signals of renewed liquidity expansion. Until spot demand re-accelerates and macro volatility subsides, Bitcoin remains sensitive to cross-asset liquidity shifts and broader macroeconomic risk sentiment.
Technical Analysis of Bitcoin (BTCUSD)
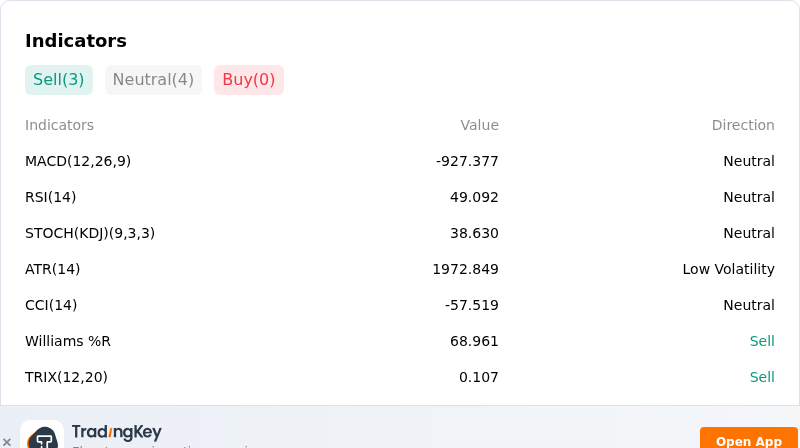
Technically, Bitcoin (BTCUSD) shows a MACD (12,26,9) value of -927.377, indicating a neutral signal. The RSI at 49.092 suggests neutral condition and the Williams %R at 68.961 suggests sell condition. Please monitor closely.
More details about Bitcoin (BTCUSD)
Recent Events and Risks:
- Institutional Spot ETF Outflows: U.S. spot Bitcoin ETFs experienced a sharp reversal into net outflows totaling over $679 million in recent trading sessions, with notable redemptions across major funds including Fidelity's FBTC and Ark's ARKB, removing a primary source of structural spot buying pressure.
- Derivatives Leverage Unwinding and Long Liquidations: The sudden break below the $82,000–$85,000 support band triggered over $1 billion in total derivative liquidations—overwhelmingly concentrated in leveraged long positions—generating automated sell orders that amplified intraday downside momentum.
- Macroeconomic Headwinds and Yield Pressures: Elevated U.S. Treasury yields, firming U.S. dollar index strength, and rising energy prices have eroded global risk-on appetite, causing institutional traders to pare back exposure to speculative digital assets ahead of key macroeconomic data releases.
- Short-Term Holder Profit-Taking and Exchange Inflows: On-chain indicators show over $1 billion in realized profits locked in as short-term holders aggressively transferred Bitcoin to centralized exchanges following rejections near major resistance levels, creating overhead selling pressure.
Recommended Articles


