

USD/CHF Price Forecast: Double top threatens 0.8220 support

Source Fxstreet
  • USD/CHF tumbles below 0.8300 after failing to conquer 0.8400.
  • RSI approaches bearish territory, signaling weakening bullish momentum.
  • Break below 0.8227 confirms double top, exposing 0.8189 and 0.8116.

The USD/CHF struggles at 0.8350, dives below the 0.8300 figure as a ‘double top’ chart pattern looms in the daily chart, even though the overall trend is up. The pair trades at 0.8269, down almost 1%.

USD/CHF Price Forecast: Technical outlook

The uptrend remains intact, as the market structure of higher highs and higher lows holds so far. Nevertheless, the USD/CHF failed to conquer 0.8400 on Wednesday, exacerbating the pair’s drop below 0.8300.

On the other hand, momentum is shifting in favour of sellers, as indicated by the Relative Strength Index (RSI), with the index trending lower and poised to turn bearish.

Nevertheless, if buyers push the USD/CHF above 0.8300, this paves the way to challenge the 0.8350 psychological level ahead of the yearly high of 0.8395. Once those levels are taken out, it would open the door to challenge 0.8400.

On the flip side, if USD/CHF extends its loss below the October 2 low of 0.8227, this would confirm the ‘double top,’ opening the door for a move towards the 50-day Simple Moving Average (SMA) of 0.8189. The next support is the 100-day SMA at 0.8116.

USD/CHF Price Chart – Daily
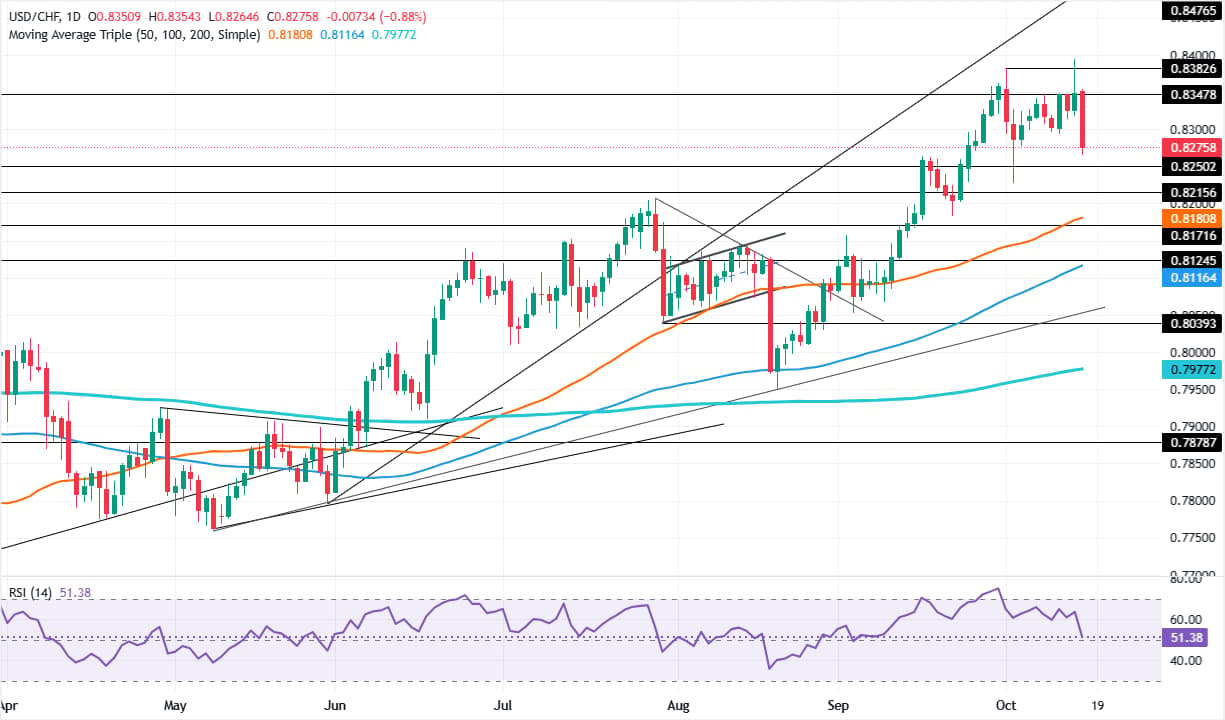
USD/CHF daily chart

Swiss Franc Price Today

The table below shows the percentage change of Swiss Franc (CHF) against listed major currencies today. Swiss Franc was the strongest against the Australian Dollar.

USD EUR GBP JPY CAD AUD NZD CHF
USD -0.44% -0.56% -0.09% -0.30% 0.77% -0.34% -0.86%
EUR 0.44% -0.13% 0.34% 0.12% 1.23% 0.09% -0.43%
GBP 0.56% 0.13% 0.46% 0.25% 1.33% 0.22% -0.31%
JPY 0.09% -0.34% -0.46% -0.22% 0.88% -0.26% -0.78%
CAD 0.30% -0.12% -0.25% 0.22% 1.07% -0.03% -0.56%
AUD -0.77% -1.23% -1.33% -0.88% -1.07% -1.10% -1.63%
NZD 0.34% -0.09% -0.22% 0.26% 0.03% 1.10% -0.55%
CHF 0.86% 0.43% 0.31% 0.78% 0.56% 1.63% 0.55%

The heat map shows percentage changes of major currencies against each other. The base currency is picked from the left column, while the quote currency is picked from the top row. For example, if you pick the Swiss Franc from the left column and move along the horizontal line to the US Dollar, the percentage change displayed in the box will represent CHF (base)/USD (quote).

Disclaimer: For information purposes only. Past performance is not indicative of future results.
placeholder
US September PPI Preview: Will Inflation Surprise Again? US Stocks, Dollar and Gold Face Key Test On October 15, US Eastern Time, the U.S. is set to release the September Producer Price Index (PPI). The September CPI released this Wednesday was notably higher than market expectations,
Author  TradingKey
12 hours ago
On October 15, US Eastern Time, the U.S. is set to release the September Producer Price Index (PPI). The September CPI released this Wednesday was notably higher than market expectations,
placeholder
Gold Price Analysis Today | Forex Gold Analysis | XAU/USD Analysis - October 15, 2026Get the latest gold price analysis, forex gold insights, and XAU/USD analysis for October 15, 2026. Read on for the details.
Author  Mitrade
14 hours ago
Get the latest gold price analysis, forex gold insights, and XAU/USD analysis for October 15, 2026. Read on for the details.
placeholder
Gold defends $4,100 as BofA targets a break below $4,000 — why the Middle East bid is missingSpot gold flushed to $4,099.89, a whisker above October's $4,090 low, then rebounded to close at $4,138.25 (+0.82%) — even as US CPI ran hot. Bank of America sees gold below $4,000 within three months, citing shrinking demand and official-sector selling. Here are the levels, the drivers and what would flip the script.
Author  Irene Q.
14 hours ago
Spot gold flushed to $4,099.89, a whisker above October's $4,090 low, then rebounded to close at $4,138.25 (+0.82%) — even as US CPI ran hot. Bank of America sees gold below $4,000 within three months, citing shrinking demand and official-sector selling. Here are the levels, the drivers and what would flip the script.
placeholder
US September CPI recap: inflation hits 3.7% as core runs hot — is an October Fed hike back on the table?September CPI landed hot: headline 3.7% y/y, core 2.6% y/y and 0.3% m/m. October hike odds jumped from ~22% to ~37% — yet the dollar faded to 101.74, gold closed higher and the S&P 500 fell 1.11%. Here is the full repricing, the levels and what to watch next.
Author  Irene Q.
15 hours ago
September CPI landed hot: headline 3.7% y/y, core 2.6% y/y and 0.3% m/m. October hike odds jumped from ~22% to ~37% — yet the dollar faded to 101.74, gold closed higher and the S&P 500 fell 1.11%. Here is the full repricing, the levels and what to watch next.
placeholder
Today’s Market Recap: September CPI Beat Ignites Rate-Hike Concerns; U.S. Stocks Fall Broadly, Oracle Drops Over 8%, SK Hynix Slips More Than 6%On October 14, Eastern Time, U.S. September CPI data came in higher than market expectations, fueling expectations of a Fed rate hike in October and dampening mar
Author  TradingKey
19 hours ago
On October 14, Eastern Time, U.S. September CPI data came in higher than market expectations, fueling expectations of a Fed rate hike in October and dampening mar
Related Instrument
goTop
quote