


Eli Lilly and Co Stock (LLY) Moved Up by 3.94% on Oct 7: Facts Behind the Movement
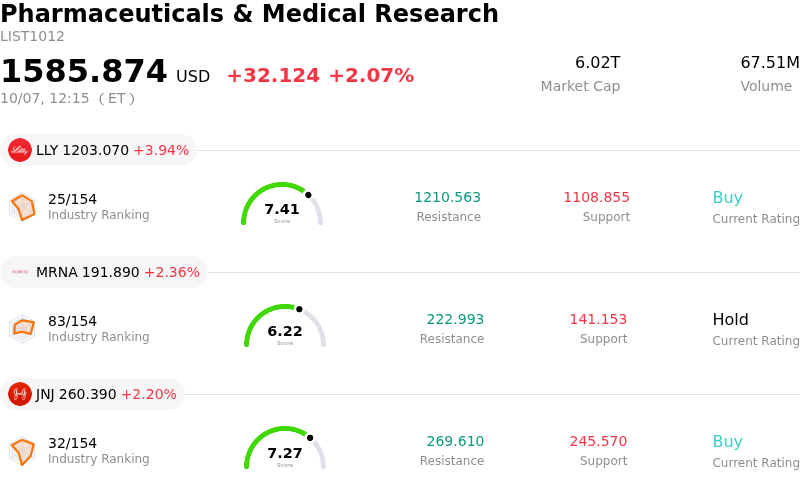
Eli Lilly and Co (LLY) moved up by 3.94%. The Pharmaceuticals & Medical Research sector is up by 2.07%. The company outperformed the industry. Top 3 stocks by turnover in the sector: Eli Lilly and Co (LLY) up 3.94%; Moderna Inc (MRNA) up 2.36%; Johnson & Johnson (JNJ) up 2.20%.
What is driving Eli Lilly and Co (LLY)’s stock price up today?
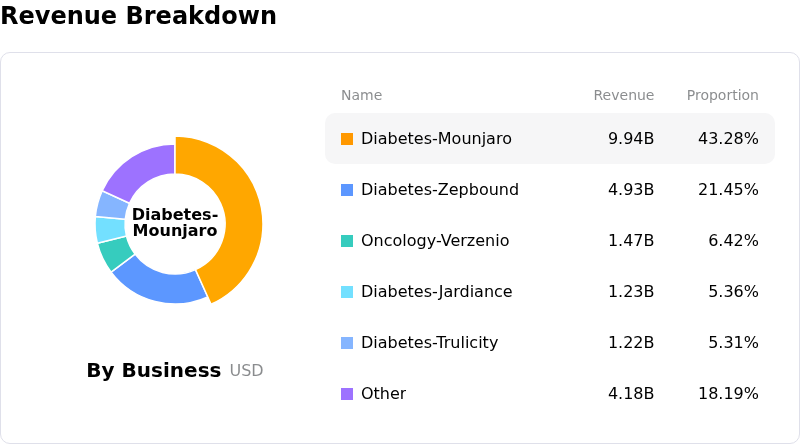
Eli Lilly experienced strong upward momentum today as positive sentiment surrounding its industry-leading cardiometabolic franchise and next-generation obesity pipeline continues to fuel investor confidence. Market participants rallied behind the pharmaceutical leader, supported by technical buying at key support levels and expanding expectations for sustained top-line growth driven by blockbusters Mounjaro and Zepbound.
A major driver of institutional enthusiasm is the company's accelerating clinical pipeline beyond its existing core offerings. Recent clinical trial updates for novel candidates, including the combination therapy EloraTZP and triple-agonist retatrutide, highlighted significant efficacy in weight reduction and blood sugar control. Simultaneously, progress with the oral GLP-1 candidate Foundayo has reinforced Lilly's ability to capture broader patient segments seeking non-injectable treatment options. Investor sentiment was further bolstered by strategic capital deployment, including the expansion of its drug discovery collaboration with Gate Bioscience to develop novel small-molecule treatments.
From a market strategy perspective, Wall Street analysts maintain a constructive long-term outlook on the equity, emphasizing the company's dominant market share in metabolic health alongside strong profit margins. As institutional investors position themselves ahead of upcoming quarterly earnings, robust underlying demand dynamics and ongoing global manufacturing expansions continue to support a valuation premium relative to broader healthcare industry peers.
Technical Analysis of Eli Lilly and Co (LLY)
Technically, Eli Lilly and Co (LLY) shows a MACD (12,26,9) value of 6.077, indicating a neutral signal. The RSI at 60.956 suggests neutral condition and the Williams %R at 14.617 suggests overbought condition. Please monitor closely.
Fundamental Analysis of Eli Lilly and Co (LLY)
Eli Lilly and Co (LLY) is in the Pharmaceuticals & Medical Research industry. Its latest annual revenue is $65.18B, ranking 4 in the industry. The net profit is $20.64B, ranking 2 in the industry. Company Profile
Over the past month, multiple analysts have rated the company as Buy, with an average price target of $1306.81, a high of $1600.00, and a low of $891.22.
More details about Eli Lilly and Co (LLY)
Company Specific Risks:
- Clinical Tolerability & Pipeline Friction: Recent Phase 2b clinical trial data for experimental obesity combination EloraTZP (eloralintide combined with tirzepatide) revealed higher patient dropout rates due to gastrointestinal side effects, casting doubt on tolerability and clinical progression for next-generation weight-loss regimens.
- Antitrust Counter-Litigation & Compounding Disputes: Federal antitrust lawsuits from compounding entities allege that Lilly engaged in anti-competitive behavior by locking telehealth providers into exclusive distribution agreements to block lower-cost compounded GLP-1 alternatives, creating ongoing legal exposure and regulatory scrutiny.
- Average Selling Price Compression in Incretin Portfolio: Expected price reductions and cash-channel discounting for core commercial drivers Zepbound and Mounjaro threaten gross margin expansion, creating downside operational risk if unit price erosion outpaces overall prescription volume growth.
- Revenue Concentration & Premium Valuation Exposure: With more than 65% of total sales heavily concentrated in Mounjaro and Zepbound, Lilly's high trailing valuation multiples render the stock vulnerable to sharp intraday drawdowns from heavy insider selling and macro sector rotation.
Recommended Articles


