


Corning Inc Stock (GLW) Moved Down by 3.28% on Sep 28: Drivers Behind the Movement
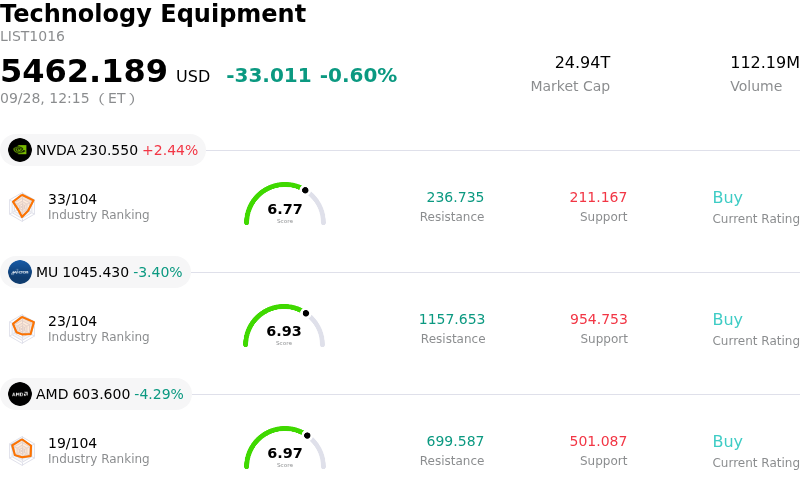
Corning Inc (GLW) moved down by 3.28%. The Technology Equipment sector is down by 0.60%. The company underperformed the industry. Top 3 stocks by turnover in the sector: NVIDIA Corp (NVDA) up 2.42%; Micron Technology Inc (MU) down 3.41%; Advanced Micro Devices Inc (AMD) down 4.29%.
What is driving Corning Inc (GLW)’s stock price down today?
Corning Incorporated experienced downward pressure and heightened intraday volatility as profit-taking gained momentum following a brief technical recovery. Investors continue to reassess rich valuations across the technology hardware and optical infrastructure sector, where elevated multiples have exposed high-growth suppliers to broader market pullbacks. As immediate optimism surrounding recent trade show demonstrations and optical-interconnect partnerships cools, market participants are refocusing on potential fundamental headwinds.
A primary catalyst behind the recent weakness is the ongoing overhang from Corning's multi-billion-dollar at-the-market equity distribution program. The announcement of potential equity issuance to finance production capacity and advanced technology buildouts has stoked persistent dilution concerns among shareholders. While management seeks to support expanding demand in optical communications, the threat of equity dilution during periods of market choppiness has constrained buying interest and amplified selling volume.
Underlying industry dynamics have also heightened investor selectivity. Markets are scrutinizing hyperscaler capital expenditure cycles and the pace of telecom fiber deployments. Although long-term secular growth drivers in artificial intelligence infrastructure and data center connectivity remain promising, near-term concerns over capital intensity, customer concentration, and recent analyst price target reductions are weighing on sentiment. These factors collectively contributed to the pull-back and sustained volatility.
Technical Analysis of Corning Inc (GLW)
Technically, Corning Inc (GLW) shows a MACD (12,26,9) value of 0.877, indicating a neutral signal. The RSI at 47.748 suggests neutral condition and the Williams %R at 67.703 suggests sell condition. Please monitor closely.
Fundamental Analysis of Corning Inc (GLW)
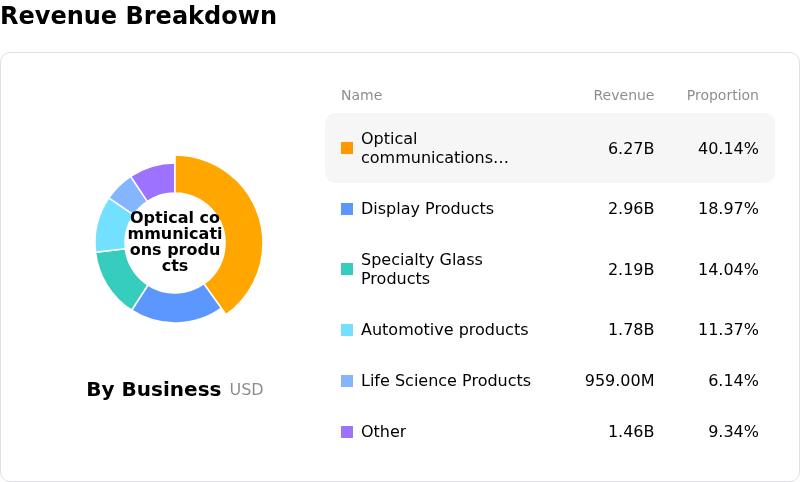
Corning Inc (GLW) is in the Technology Equipment industry. Its latest annual revenue is $15.63B, ranking 7 in the industry. The net profit is $1.60B, ranking 3 in the industry. Company Profile
Over the past month, multiple analysts have rated the company as Buy, with an average price target of $190.15, a high of $238.00, and a low of $129.00.
More details about Corning Inc (GLW)
Company Specific Risks:
- Dilution Overhang from $2 Billion At-The-Market Equity Program: Corning's disclosure of a $2 billion at-the-market equity distribution agreement with Goldman Sachs has introduced ongoing selling pressure and intraday volatility, as market participants weigh the immediate dilutive impact on existing shares to fund capital-intensive manufacturing expansions.
- Capital Intensity and Glass Furnace Expansion Risks: Scaling production to satisfy AI demand requires constructing asset-heavy glass optical fiber furnaces rather than asset-light assembly lines, exposing the company to elevated capital expenditure risks if AI infrastructure spend decelerates.
- Customer Concentration in Long-Term Optical Fiber Commitments: The company's revenue acceleration depends heavily on concentrated multi-year supply agreements with key telecom and enterprise partners such as Verizon, making earnings vulnerable to potential order deferrals, project timeline slips, or capex cuts by major clients.
- Elevated Valuation Multiples and Multiple Compression Vulnerability: Following an AI-driven momentum run, GLW trades at an inflated trailing P/E exceeding 70x and a forward P/E near 37x, creating acute downside sensitivity to multiple compression if growth targets under its Springboard plan encounter operational friction.
Recommended Articles


