Official Trump massive $300M token unlock spells doom

Mitrade
coverImg
Source: DepositPhotos
  • Official Trump meme coin faces 40 million $TRUMP token unlock on Friday, threatening more pain for investors.

  • Investors brace for a hard landing, as this unlock accounts for 20% of the market capitalization and 4% of the total supply.

  • Official Trump could absorb the supply shock if a double-bottom pattern ignites a bullish reversal from support at $7.40.


Official Trump ($TRUMP), the Presidential meme coin launched in January by the United States (US) President Trump family’s World Liberty Financial company, is in a precarious situation that could see volatility spike significantly. 


According to the token unlock schedule, 40 million $TRUMP will be released on Friday, joining the circulating supply. The meme coin exchanges hands at $7.62 at the time of writing.


Official Trump 40 million token unlock signals more pain


The $TRUMP meme coin on the Solana blockchain is set to undergo a significant token unlock on Friday, with 40 million tokens valued at $305 million. This represents 4% of the total supply (1 billion coins) and approximately 20% of the market capitalization (200 million coins in circulating supply), per Cryptorank data. 


It is worth noting that the unlock is primarily allocated to team wallets and Trump-affiliated entities. Investors should brace for heightened volatility and a possible impact on the price as liquidity surges. 


Crypto markets, in general, are facing declining investor sentiment due to the trade war between the US and China. Moreover, no one knows how negotiations during the 90-day reciprocal tariffs’ pause will play out.


Following the token unlock on Friday, $TRUMP’s circulating supply will jump from 200 million to 240 million tokens – a 20% increase. Historically, large token unlocks often result in downward pressure, especially if the recipients of the coins sell on the open market.


The Official Trump meme coin is already down approximately 90% from its all-time high of $76.76 on January 19. It is losing more than 26% of its value in April, signaling waning investor confidence.


Technical indicators like the Moving Average Convergence Divergence (MACD) and the Relative Strength Index (RSI) reinforce the persistent bearish momentum. Moreover, $TRUMP holds below the 4-hour 50, 100 and 200 Exponential Moving Averages (EMAs), which further highlight the fragile technical structure.
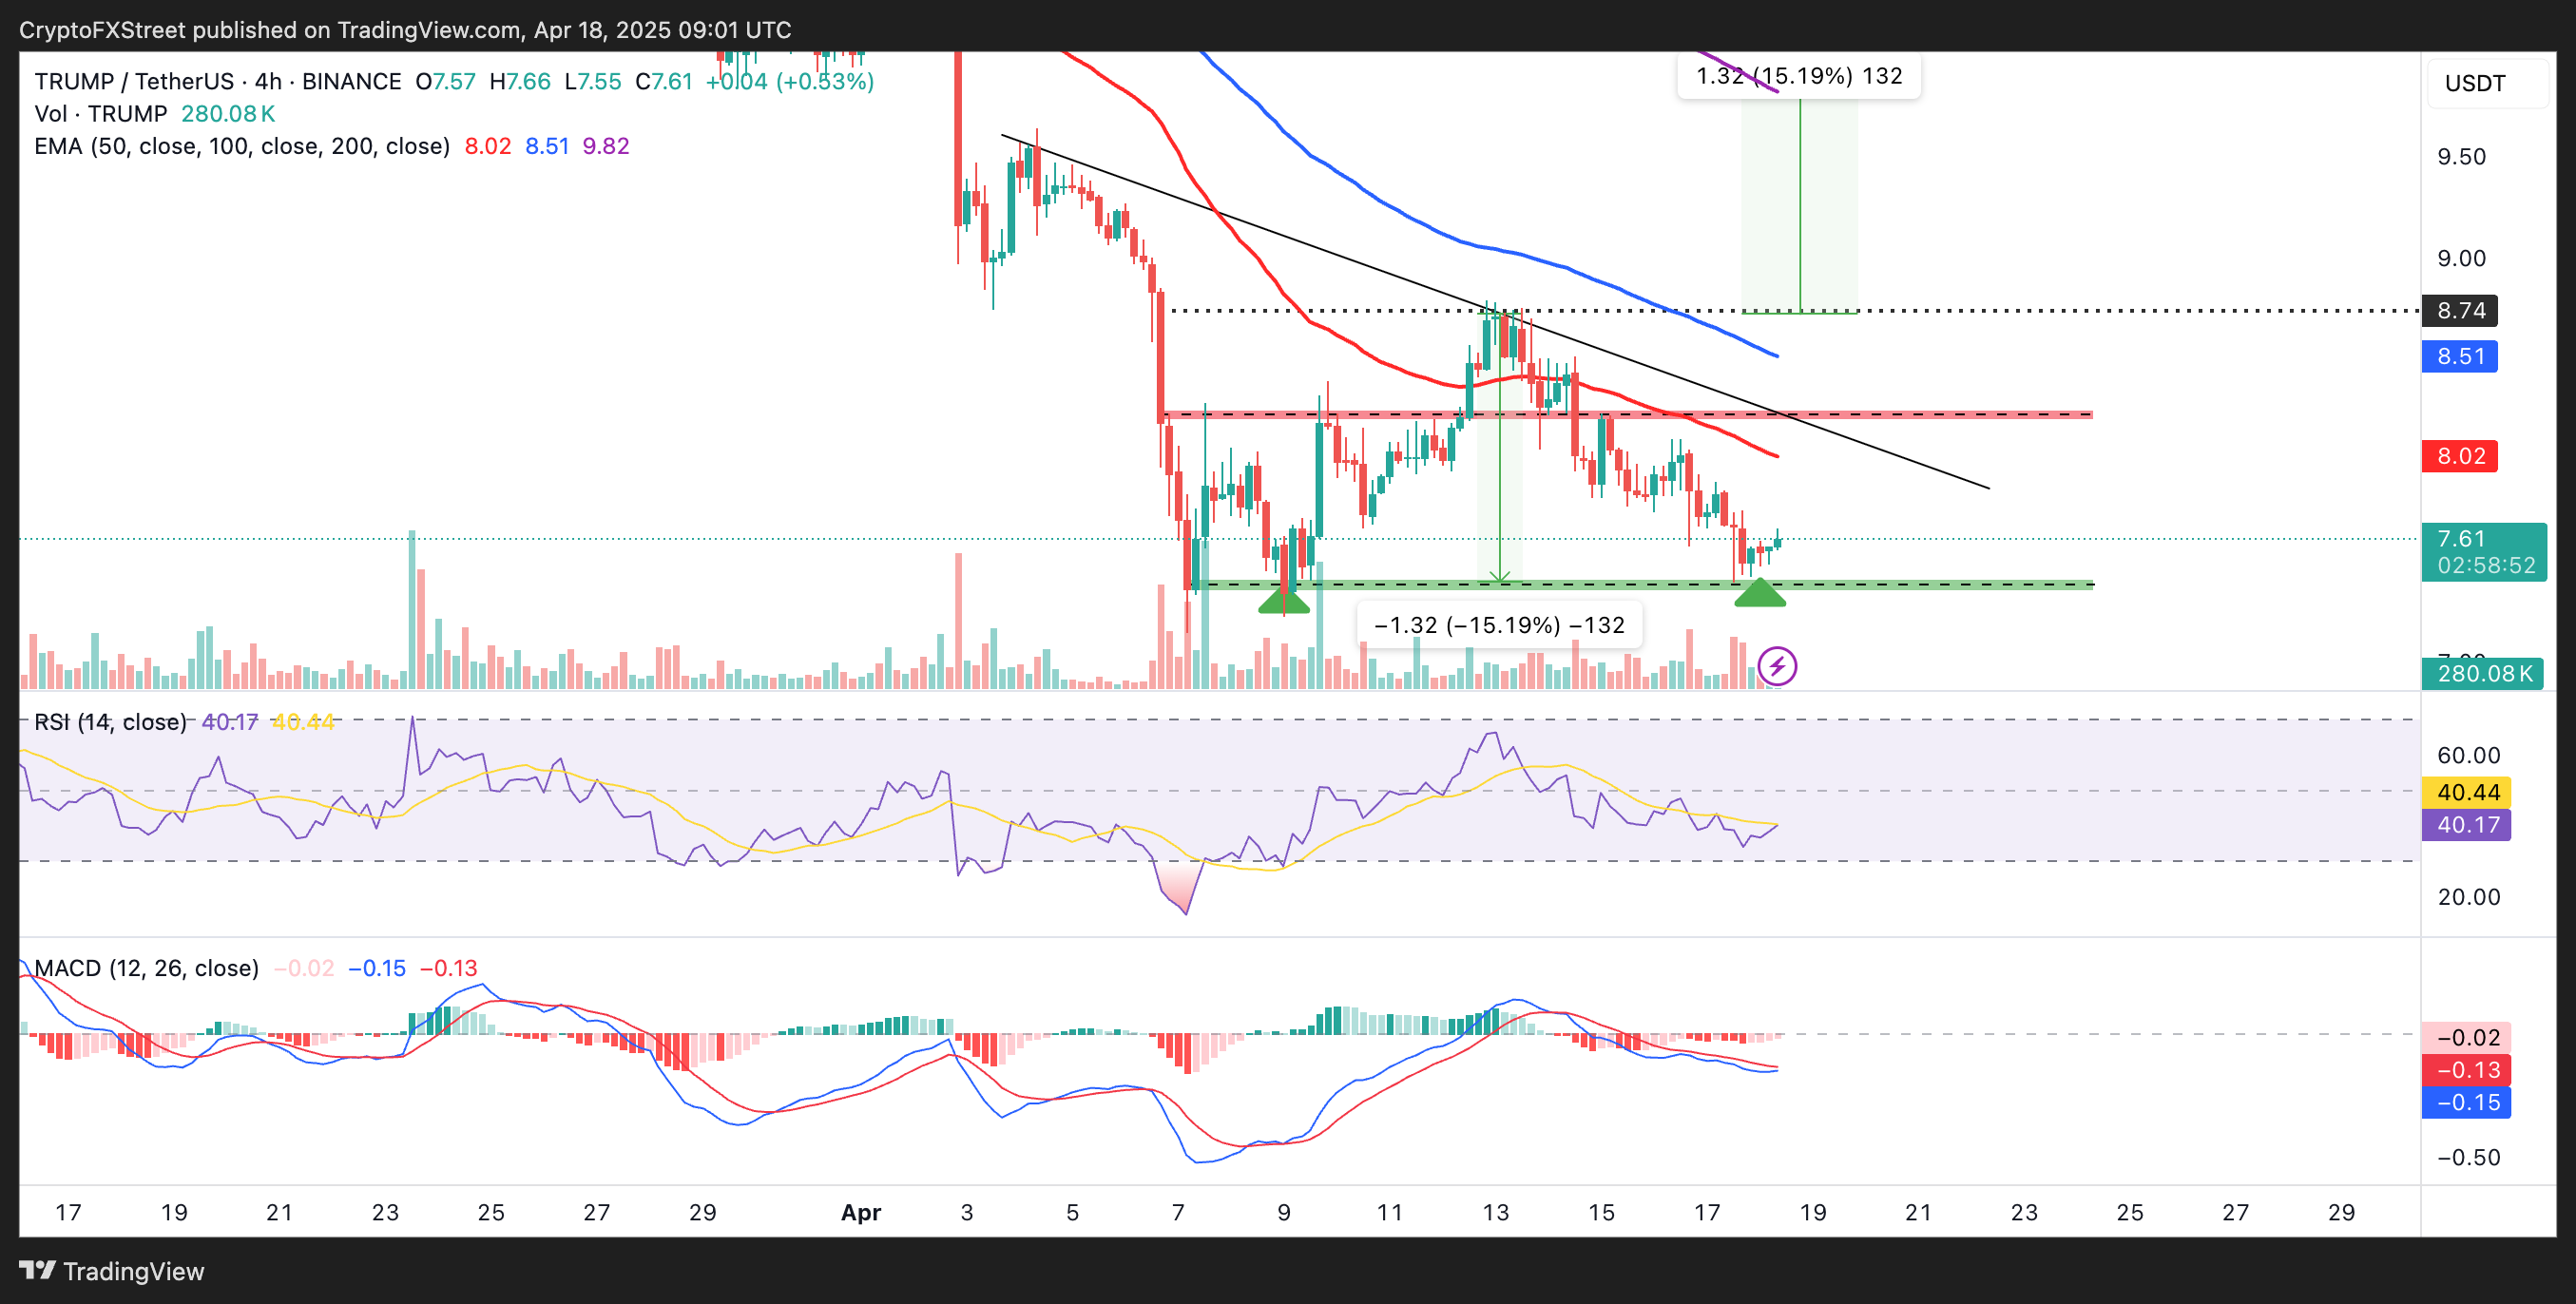


$TRUMP/USDT 4-hour chart


On the flip side, a double-bottom pattern has been forming in the same 4-hour timeframe, which could help shape a trend reversal in the coming days. For this pattern to hold, support at $7.40 must remain intact, and the impact from the token unlock must be minimal. 


Moreover, the pattern’s resistance at $8.74 has to give way for a 15% breakout above the hurdle to $9.82. This target is arrived at by measuring the distance between the pattern’s bottom and top, extrapolated above the breakout point. However, losing the local bottom support at $7.40 may accelerate the sell-off, with $TRUMP creating new all-time lows.

Read more

  • Gold Price Forecast: XAU/USD regains ground below $3,700, outlook remains fragile
  • Gold Hits Near 1.5-Year Low Below $3,800 as Bears Threaten Drop to $3,500
  • Australian Dollar falls below 0.6700 as Unemployment Rate jumps to the highest level in five years
  • * The content presented above, whether from a third party or not, is considered as general advice only.  This article should not be construed as containing investment advice, investment recommendations, an offer of or solicitation for any transactions in financial instruments.

    goTop
    quote
    Related Articles
    placeholder
    Nvidia posts record $115.8B Q3 revenue, but crypto stays mutedThe crypto market remained subdued on Tuesday despite Nvidia's (NVDA) Q3 earnings release beating analysts' expectations as demand for artificial intelligence infrastructure continued to drive growth across its business.
    Author  FXStreet
    Nov 18, Wed
    The crypto market remained subdued on Tuesday despite Nvidia's (NVDA) Q3 earnings release beating analysts' expectations as demand for artificial intelligence infrastructure continued to drive growth across its business.
    placeholder
    Ethereum Drops Below $2,000 After Plunging Over 20% in a Month as Odds of $1,500 Retest SurgeEthereum Plunges Over 20% in a Month, Risking a Retest of $1,500 After Losing the $2,000 Defense Line.On November 13, Ethereum (ETH) plunged more than 5%, officially falling below the key
    Author  TradingKey
    Nov 13, Fri
    Ethereum Plunges Over 20% in a Month, Risking a Retest of $1,500 After Losing the $2,000 Defense Line.On November 13, Ethereum (ETH) plunged more than 5%, officially falling below the key
    placeholder
    Bitcoin lost its 200-day average — but the exit started three sessions before the CPIBitcoin fell 2.5% to about $73,400 on 11 November, an 11-week low, breaking its 200-day moving average near $73,100. The 24-hour liquidation tally reached $632 to $705 million, roughly 82% of it longs. But spot ETF outflows began three sessions earlier and USDT's market cap has shrunk $6.6 billion in 60 days — the leveraged length left before the inflation print did. A double top at 81,890 and 81,080 leaves a measured target of 69,366.
    Author  Suzie
    Nov 11, Wed
    Bitcoin fell 2.5% to about $73,400 on 11 November, an 11-week low, breaking its 200-day moving average near $73,100. The 24-hour liquidation tally reached $632 to $705 million, roughly 82% of it longs. But spot ETF outflows began three sessions earlier and USDT's market cap has shrunk $6.6 billion in 60 days — the leveraged length left before the inflation print did. A double top at 81,890 and 81,080 leaves a measured target of 69,366.
    placeholder
    Bitcoin Price Forecast: BTC faces pressure as weekly ETF outflows hit $1.28 billionBitcoin (BTC) remains under pressure on Monday, trading below the 50-week Simple Moving Average (SMA) at $75,222 after extending its losing streak to five consecutive weeks.
    Author  FXStreet
    Nov 09, Mon
    Bitcoin (BTC) remains under pressure on Monday, trading below the 50-week Simple Moving Average (SMA) at $75,222 after extending its losing streak to five consecutive weeks.
    placeholder
    Bitcoin ETFs sold $1.28 billion in a week — and BTC is still above 75,000US spot Bitcoin ETFs logged $1.28 billion of net outflows in the week to Nov 6, the largest since late June, with BlackRock's IBIT accounting for $1.21 billion. Yet BTC only fell from $80,405 to $74,940, a 6.8% move. The gap between the fund flow and the price is the story: leveraged longs were flushed, but spot holders did not follow the ETFs out — and $75,000 is the line that decides whether that reading holds.
    Author  Suzie
    Nov 09, Mon
    US spot Bitcoin ETFs logged $1.28 billion of net outflows in the week to Nov 6, the largest since late June, with BlackRock's IBIT accounting for $1.21 billion. Yet BTC only fell from $80,405 to $74,940, a 6.8% move. The gap between the fund flow and the price is the story: leveraged longs were flushed, but spot holders did not follow the ETFs out — and $75,000 is the line that decides whether that reading holds.
    Live Quotes
    Name / SymbolChart% Change / Price
    TRUMPUSD
    TRUMPUSD
    0.00%0.00

    cryptocurrency Related Articles

    • Top 3 Price Prediction: Bitcoin, Ethereum, Ripple — Bulls take the reins, with $100K BTC, $3,500 ETH and $2.35 XRP in focus
    • Best Strategies When BTC Price Drops: From Hedging to Accumulating
    • How to Day Trade Crypto? Simplest Day Trading Strategy Ever
    • Trading Chart Patterns:Ultimate Guide to Price Action
    • Places that Provide Cheapest Ways to Buy Bitcoin In 2025
    • 10 Best Crypto With Most Potential to Buy and invest in 2025 - Top Picks from Expert Traders

    Click to view more