


Dogecoin Is Repeating Its 2020 Accumulation Cycle, Analyst Says


Crypto analyst Cryptollica (@Cryptollica on X) is arguing that Dogecoin’s weekly chart is doing that familiar thing again: carving out a rounded base, bleeding off volatility, resetting momentum and quietly setting up what he frames as the “calm before the storm.”
Or, at least, that’s the pitch. In a Dec. 23 TradingView analysis titled “DOGE: The Cycle Repeats (1W Timeframe),” Cryptollica calls the current structure a “textbook fractal setup,” pointing to four prior “structural points (1, 2, 3, 4)” across DOGE’s longer-term history and claiming the market is now sitting at “Point 4.” The core claim is less about a single indicator and more about pattern recognition: “the structure is rhyming perfectly with the pre-bull run accumulation phases of the past.”
Will Dogecoin Repeat History?
Cryptollica frames Zones 1 and 2 as prior “boredom phases” — the type of long, dead-feeling stretches that, in hindsight, look like accumulation. “Zones 1 & 2: These were the ‘boredom phases’ where volatility died, and smart money accumulated,” the post reads.
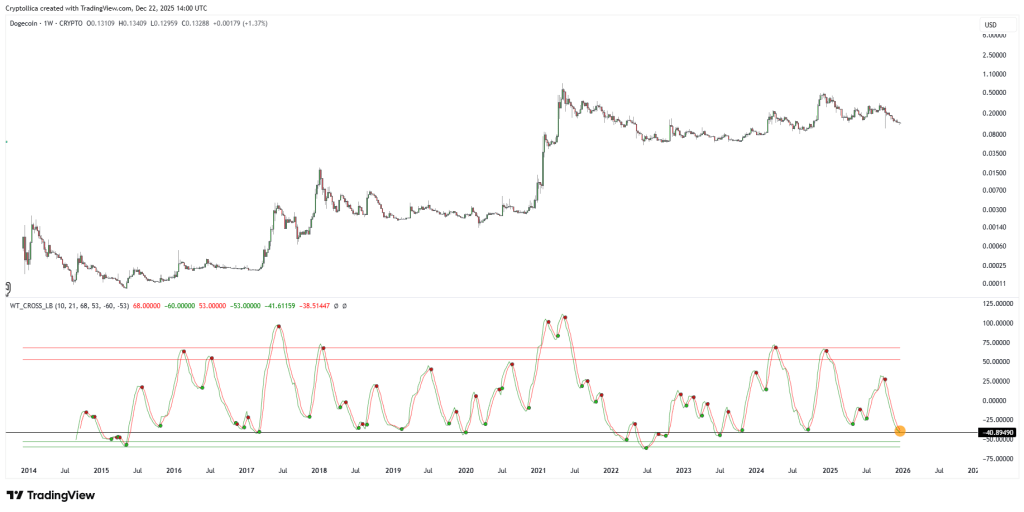
Zone 2, in particular, is described as “the launchpad for the massive 2021 parabolic run.” The current period, which the analyst labels Zone 4, is presented as a near-mirror: “We are seeing the exact same rounding bottom formation. The price is stabilizing, forming a heavy base just like it did before the previous explosions.”
That’s the structural argument. The momentum argument is RSI, and Cryptollica is unusually direct about how they’re treating it: “Look at the RSI indicator at the bottom. The red line (~32. level) acts as a historical floor.”
They add that “every single time the weekly RSI touched or hovered near this baseline (Points 1, 2, and 3), it marked a macro bottom.” Right now, in their read, “the RSI has reset back to this critical support level,” which they interpret as seller fatigue: “It indicates that the sellers are exhausted and the momentum is primed to flip.”
If you’ve been around crypto markets long enough, you’ve seen this exact rhetorical move: the past as a template, the present as a rhyme, the future as a pending punchline. Cryptollica tries to pre-empt the eye-roll by insisting the setup isn’t coincidence: “This isn’t just random noise; it’s a cyclical reset.” The post argues DOGE is sitting in what they call “the ‘Golden Pocket’ for accumulation,” and suggests that if the 2020-era analog holds “like it did in 2020 (Zone 2)” then today’s price action is basically quiet loading time.
The editorial machinery at TradingView itself leaned in. The platform responded publicly on Dec. 23 that the publication “has been selected as one of our Editor’s Picks and will be featured on the Home Page,” adding a line that reads like the house style for community encouragement: “Good trading plans are valuable, regardless of their outcomes, and particularly rewarding when they succeed.” Cryptollica replied in kind: “TradingView, thank you.”
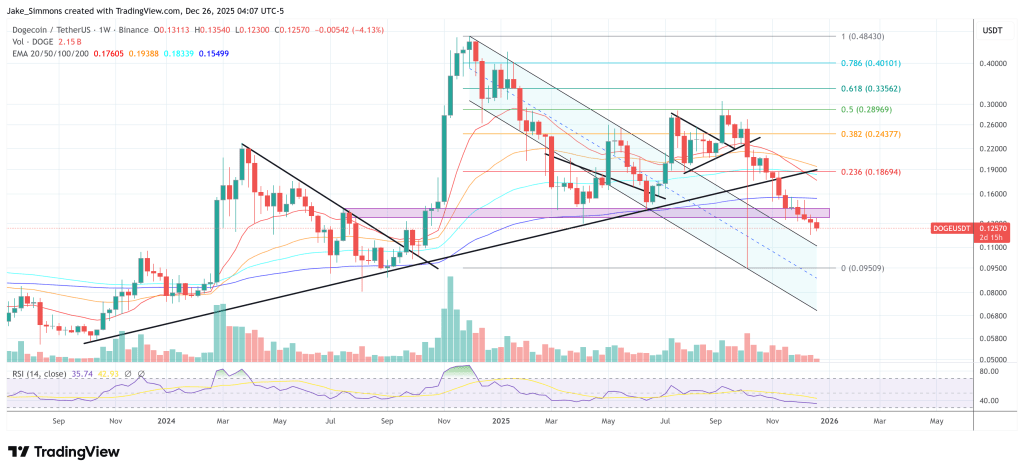
Still, one of the more useful parts of this whole thread is a cautionary comment from another user, ZarinSyed, who essentially says: yes, the fractal is interesting, no, that doesn’t mean it’s fate. “The fractal analysis is compelling,” they wrote, “however, while the setup does resemble prior accumulation phases, it’s worth noting that fractals are not deterministic — macro conditions and liquidity flows can alter outcomes.” They put a practical marker on what “confirmation” would look like in their view: “Watching DOGE’s weekly close above the $0.15–$0.17 range could validate the bullish thesis.”
And they don’t let RSI off the hook, either. The ~32 level may signal exhaustion, they concede, but “momentum confirmation often requires a sustained move above the midline (50). Until then, the risk of prolonged sideways action remains.” They add a market-structure wrinkle that matters for 2026-style crypto narratives: “Unlike 2020, DOGE now trades in a more mature market with ETF-driven institutional flows. Retail-driven fractals may play out differently.”
So what does it mean, in plain trader terms, without pretending the chart is prophecy? Cryptollica is making a high-conviction, weekly-timeframe claim that DOGE is back in an accumulation “buy zone,” with RSI near a historical floor and a rounded base that resembles prior cycle setups.
ZarinSyed is basically saying: fine, now prove it, ideally with a breakout and follow-through, and keep an eye on relative metrics like DOGE/BTC dominance if you want to know whether this is a DOGE story or just another alt wobble.
At press time, DOGE traded at $
Read more
Disclaimer: The content available on Mitrade Insights is provided for informational and marketing purposes only. It has not been prepared in accordance with legal requirements designed to promote the independence of investment research and is not subject to any prohibition on dealing ahead of the dissemination of investment research.
Nothing in this material constitutes investment advice, personal recommendation, investment research, an offer, or a solicitation to buy or sell any financial instrument. The content has been prepared without consideration of your individual investment objectives, financial situation, or needs, and should not be treated as such.
Past performance is not a reliable indicator of future performance and/or results. Forward-looking scenarios or forecasts are not a guarantee of future performance. Actual results may differ materially from those anticipated.
Mitrade makes no representation or warranty as to the accuracy or completeness of the information provided and accepts no liability for any loss arising from reliance on such information.


