Bitcoin Poised For ‘Boring’ 2025 Close – Here’s When BTC’s Real Test Will Come

Mitrade
coverImg
Source: DepositPhotos

After failing to turn the $90,000 area, Bitcoin (BTC) continues to move within its local range with apparent no clear direction. Some market observers have suggested that the flagship crypto will remain rangebound until next year, when its potential moment of truth will come.

Bitcoin Takes Holiday Break

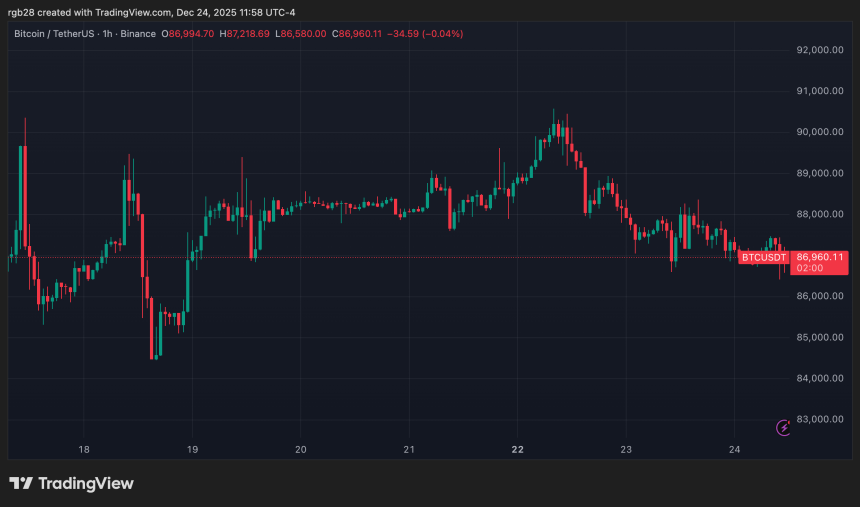
On Christmas Eve Day, Bitcoin continued with its sideways trajectory, trading between the $86,000-$87,000 levels throughout the day. The cryptocurrency has been hovering within the $80,000-$94,000 levels since the late November correction, failing to break out of its one-month range despite earlier attempts.

Notably, BTC’s price has been trading around the mid-zone of its range, moving between the $84,000-$90,000 levels for nearly two weeks. Analyst Ted Pillows noted that Bitcoin “is still in no trading zone,” arguing that if the price doesn’t reclaim the $90,000 resistance area, the price could risk another retest of the $84,000 support.

However, if the support and resistance levels don’t break, it will continue to move within its range until the market’s momentum returns. Meanwhile, Daan Crypto Trades highlighted that December has been “a very boring month all things considered.”

In an X post, he explained that there the broader crypto market had “no major narratives, no major moves. Just a lot of up days followed by down days. With alts bleeding lower in the end and BTC & ETH roughly stable.”

The trader also asserted that it hasn’t been BTC’s best year despite reaching new highs this quarter. He pointed out that “this year was abysmal, especially looking at the risk adjusted returns.”

Nonetheless, he noted that “during years like these, we are taking big steps towards distributing coins from OG large holders and get a more evenly spread supply. Regardless of price action in the short term, that’s always a good thing to see.”

BTC To Breakout Or Breakdown In 2026?

Daan affirmed that Q1 2026 will be the moment where Bitcoin can “try and prove itself” and when everyone will be closely watching the cryptocurrency’s performance to determine whether the cycle is over or not.

Other market watchers have suggested two potential scenarios for BTC’s early 2026 performance. Ted Pillows highlighted that BTC appears to be mirroring its 2021-2022 fractal, which suggests that the flagship cryptocurrency is ultimately entering a bear market.

Per the chart, Bitcoin saw a significant pullback after topping in late 2021. This was followed by brief recovery period at the start of 2022 before the price continued its descending trajectory.

Based on this, the analyst forecasted a rally towards $100,000 at the start of 2026 before its next leg down, which could target the $60,000-$70,000 area. On the contrary, Eljaboom pointed out that BTC could be repeating its performance from the start of the year.

As he noted, BTC displays a multi-month falling wedge pattern on the three-day chart similar to the one that formed between Q4 2024 and Q2 2025 and led to the Q3 3035 rally.

If history repeats, the cryptocurrency could retest the pattern’s lower boundary in the coming weeks before breaking out of the formation and potentially moving to new highs by Q2 2026.

As of this writing, Bitcoin trades at $87,350, a 0.5% decline in the daily timeframe.
bitcoin, btc, btcusdt

Read more

  • Spot Gold Breaches Four Key Levels, Putting $3,500 at Risk as Technicals Enter Oversold Alert Zone
  • * The content presented above, whether from a third party or not, is considered as general advice only.  This article should not be construed as containing investment advice, investment recommendations, an offer of or solicitation for any transactions in financial instruments.

    goTop
    quote
    Related Articles
    placeholder
    Nvidia posts record $115.8B Q3 revenue, but crypto stays mutedThe crypto market remained subdued on Tuesday despite Nvidia's (NVDA) Q3 earnings release beating analysts' expectations as demand for artificial intelligence infrastructure continued to drive growth across its business.
    Author  FXStreet
    Nov 18, Wed
    The crypto market remained subdued on Tuesday despite Nvidia's (NVDA) Q3 earnings release beating analysts' expectations as demand for artificial intelligence infrastructure continued to drive growth across its business.
    placeholder
    Ethereum Drops Below $2,000 After Plunging Over 20% in a Month as Odds of $1,500 Retest SurgeEthereum Plunges Over 20% in a Month, Risking a Retest of $1,500 After Losing the $2,000 Defense Line.On November 13, Ethereum (ETH) plunged more than 5%, officially falling below the key
    Author  TradingKey
    Nov 13, Fri
    Ethereum Plunges Over 20% in a Month, Risking a Retest of $1,500 After Losing the $2,000 Defense Line.On November 13, Ethereum (ETH) plunged more than 5%, officially falling below the key
    placeholder
    Bitcoin lost its 200-day average — but the exit started three sessions before the CPIBitcoin fell 2.5% to about $73,400 on 11 November, an 11-week low, breaking its 200-day moving average near $73,100. The 24-hour liquidation tally reached $632 to $705 million, roughly 82% of it longs. But spot ETF outflows began three sessions earlier and USDT's market cap has shrunk $6.6 billion in 60 days — the leveraged length left before the inflation print did. A double top at 81,890 and 81,080 leaves a measured target of 69,366.
    Author  Suzie
    Nov 11, Wed
    Bitcoin fell 2.5% to about $73,400 on 11 November, an 11-week low, breaking its 200-day moving average near $73,100. The 24-hour liquidation tally reached $632 to $705 million, roughly 82% of it longs. But spot ETF outflows began three sessions earlier and USDT's market cap has shrunk $6.6 billion in 60 days — the leveraged length left before the inflation print did. A double top at 81,890 and 81,080 leaves a measured target of 69,366.
    placeholder
    Bitcoin Price Forecast: BTC faces pressure as weekly ETF outflows hit $1.28 billionBitcoin (BTC) remains under pressure on Monday, trading below the 50-week Simple Moving Average (SMA) at $75,222 after extending its losing streak to five consecutive weeks.
    Author  FXStreet
    Nov 09, Mon
    Bitcoin (BTC) remains under pressure on Monday, trading below the 50-week Simple Moving Average (SMA) at $75,222 after extending its losing streak to five consecutive weeks.
    placeholder
    Bitcoin ETFs sold $1.28 billion in a week — and BTC is still above 75,000US spot Bitcoin ETFs logged $1.28 billion of net outflows in the week to Nov 6, the largest since late June, with BlackRock's IBIT accounting for $1.21 billion. Yet BTC only fell from $80,405 to $74,940, a 6.8% move. The gap between the fund flow and the price is the story: leveraged longs were flushed, but spot holders did not follow the ETFs out — and $75,000 is the line that decides whether that reading holds.
    Author  Suzie
    Nov 09, Mon
    US spot Bitcoin ETFs logged $1.28 billion of net outflows in the week to Nov 6, the largest since late June, with BlackRock's IBIT accounting for $1.21 billion. Yet BTC only fell from $80,405 to $74,940, a 6.8% move. The gap between the fund flow and the price is the story: leveraged longs were flushed, but spot holders did not follow the ETFs out — and $75,000 is the line that decides whether that reading holds.
    Live Quotes
    Name / SymbolChart% Change / Price
    BTCUSD
    BTCUSD
    0.00%0.00
    ETHUSD
    ETHUSD
    0.00%0.00

    cryptocurrency Related Articles

    • Top 3 Price Prediction: Bitcoin, Ethereum, Ripple — Bulls take the reins, with $100K BTC, $3,500 ETH and $2.35 XRP in focus
    • Best Strategies When BTC Price Drops: From Hedging to Accumulating
    • How to Day Trade Crypto? Simplest Day Trading Strategy Ever
    • Trading Chart Patterns:Ultimate Guide to Price Action
    • Places that Provide Cheapest Ways to Buy Bitcoin In 2025
    • 10 Best Crypto With Most Potential to Buy and invest in 2025 - Top Picks from Expert Traders

    Click to view more