


WTI holds weekly gains near $96 amid risk premium to oil prices
- WTI Oil price clings to gains near $96.00 as markets continue to offer risk premium to oil prices.
- ING says that risk premium to oil prices could erode if flows through Hormuz remain sustained.
- The IEA agrees to release the remaining 100 million barrels of oil from strategic reserves.
West Texas Intermediate (WTI), futures on NYMEX, holds onto weekly gains near $96.00 during the European trading session on Friday. The oil price has gained significantly this week, as financial markets continue to offer risk premium due to prolonged Middle East conflicts.
However, market experts argue that risk premium attached to oil prices could start eroding if flows through the Middle East, with the help of United States (US) military, remain sustained.
Oil flows hold firm through Strait of Hormuz despite security incidents
Analysts at Commerzbank highlight the resilience of shipping activity through the Strait of Hormuz, noting that, “despite the attacks, US Central Command (CENTCOM) said more than 40 vessels transited the strait in the prior 24 hours and oil flow reportedly hit 12 million barrels a day.” This underscores that, even amid heightened security concerns, headline crude supply routes have so far remained largely uninterrupted.
Strategists at ING argue that "the longer this pickup in flows continues, the more likely the market will start giving back some of this risk premium." However, ING stresses that "in order to see a full removal, there needs to be some kind of agreement between the US and Iran," adding that such a deal "would provide the market with more confidence that stronger oil flows from the region will continue."
However, continued restrictions by Iranian military for ships attempting to pass the Hormuz strait keep energy supply fears intact. According to a Reuters report, maritime officials said this week that a container ship and a dry bulk carrier have both sunk near the Hormuz in the past 24 hours after being hit by projectiles in separate incidents.
Meanwhile, the International Energy Agency (IEA) has now agreed to "release the remaining 100 million barrels of oil from strategic reserves," completing the drawdown first announced in response to the Persian Gulf supply shortfall, ING reported.
WTI Technical Analysis
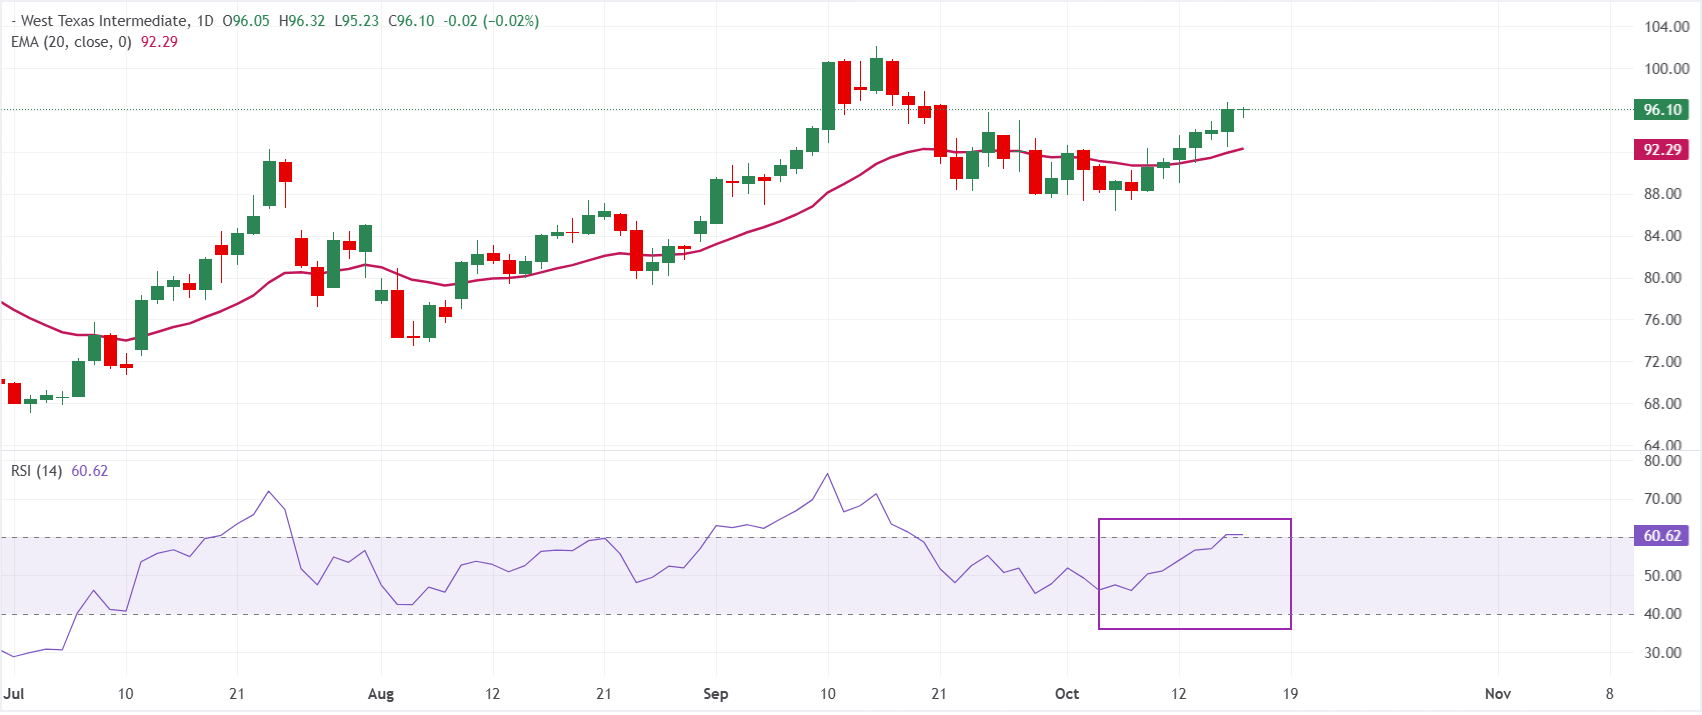
In the daily chart, WTI US Oil trades at $96.11. The contract holds a bullish near-term bias as it extends above the 20-day Exponential Moving Average (EMA) at $92.29, suggesting buyers remain in control after the latest advance. Momentum reinforces this constructive tone, with the Relative Strength Index (14) hovering around 60, indicating firm but not yet overbought conditions.
On the downside, immediate support is seen at the 20-day EMA near $92.29, which underpins the current uptrend and would be the first line of defense on any pullback. As long as WTI holds above this moving average, the technical setup favors dip-buying rather than aggressive selling, with the current price around $96.11 acting as a near-term pivot for directional moves.
(The technical analysis of this story was written with the help of an AI tool. Know more.)
WTI Oil FAQs
WTI Oil is a type of Crude Oil sold on international markets. The WTI stands for West Texas Intermediate, one of three major types including Brent and Dubai Crude. WTI is also referred to as “light” and “sweet” because of its relatively low gravity and sulfur content respectively. It is considered a high quality Oil that is easily refined. It is sourced in the United States and distributed via the Cushing hub, which is considered “The Pipeline Crossroads of the World”. It is a benchmark for the Oil market and WTI price is frequently quoted in the media.
Like all assets, supply and demand are the key drivers of WTI Oil price. As such, global growth can be a driver of increased demand and vice versa for weak global growth. Political instability, wars, and sanctions can disrupt supply and impact prices. The decisions of OPEC, a group of major Oil-producing countries, is another key driver of price. The value of the US Dollar influences the price of WTI Crude Oil, since Oil is predominantly traded in US Dollars, thus a weaker US Dollar can make Oil more affordable and vice versa.
The weekly Oil inventory reports published by the American Petroleum Institute (API) and the Energy Information Agency (EIA) impact the price of WTI Oil. Changes in inventories reflect fluctuating supply and demand. If the data shows a drop in inventories it can indicate increased demand, pushing up Oil price. Higher inventories can reflect increased supply, pushing down prices. API’s report is published every Tuesday and EIA’s the day after. Their results are usually similar, falling within 1% of each other 75% of the time. The EIA data is considered more reliable, since it is a government agency.
OPEC (Organization of the Petroleum Exporting Countries) is a group of 12 Oil-producing nations who collectively decide production quotas for member countries at twice-yearly meetings. Their decisions often impact WTI Oil prices. When OPEC decides to lower quotas, it can tighten supply, pushing up Oil prices. When OPEC increases production, it has the opposite effect. OPEC+ refers to an expanded group that includes ten extra non-OPEC members, the most notable of which is Russia.
Recommended Articles


