


General Motors Stock Forecast: GM Heads Into Q3 Earnings Pressing Against $84.62 Triangle Resistance
TradingKey - General Motors (GM) is coiled just below an important breakout level heading into the weekend. GM closed at $83.66 on Thursday, October 15, up 0.73% and about 9% below its 52-week high of $91.85. GM is up roughly 47% from its 52-week low of $56.81.
For the week ahead, my thesis is a simple one: trucks and tariff relief are carrying earnings, while the EV business rapidly shrinks. The catalyst is set for Tuesday, October 20, when GM reports Q3 results. Following positive news and a further run may not be likely.
Guidance Has Already Been Raised Twice This Year
In the second guidepost of this article, I mention that GM increased its 2026 guidance for the second time in the year, in July. GM now expects EBIT-adjusted in the range of $14 to $16 billion, adjusted EPS in the range of $12 to $14, and adjusted automotive free cash flow in the range of $9.5 to $11.5 billion.
GM’s main profit measure is EBIT-adjusted, or profit before interest and taxes, and adjusting for one-time items. The key question for me on Tuesday is whether the management team increases or holds the EBIT-adjusted profit range.
Q2 Showed Where the Profit Comes From
Q2 reported EBIT-adjusted profits rose approximately 30% to $3.9 billion, while revenues only grew about 2% to $48.0 billion. Clearly, GM is earning more profit per vehicle, as opposed to selling more vehicles.
The EBIT-adjusted margin for North America also improved 2.5 points to 8.6% and is back in GM’s targeted range of 8% to 10%. Adjusted EPS for the quarter also beat estimates at $3.57, compared to the $3.18 consensus. For the upcoming quarter, analysts expect EPS of approximately $3.52 on revenues of approximately $48.7 billion.
Tariff Relief Is a Real Tailwind
What grabs my attention is how much relief there has been on the tariff front. General Motors lowered its expected 2026 tariff cost to $2.5 billion to $3.5 billion from $3 billion to $4 billion, citing the Supreme Court decision that struck down tariffs under the International Emergency Economic Powers Act.
That reduction mostly accounted for April’s guidance increase. Also, new tariff action would impact the same line directly, creating policy risk.
The EV Business Is Shrinking Fast
Q3 U.S. sales declined 6% to 670,974, with GM attributing the decline to a smaller EV market and discontinued models. U.S. EV sales dropped 61.7% to 25,473, representing 3.8% of the total U.S. sales, down from 9.4% the year prior, with the Equinox EV sales declining 92.4%.
Decreased EV sales volumes may improve margin, as each unit has been losing money. GM took $2.3 billion of EV restructuring charges in Q2 and $3.4 billion in the first half, so I would closely watch for additional charges on Tuesday.
Trucks and Small SUVs Carry the Earnings
Stability in the core business is also worth noting. GM continues to lead in full-size pickups and full-size SUVs, as well as fleet sales. For a fourth straight quarter, GM led the industry in fleet sales. GM's small and affordable SUVs also set record sales for the quarter, with the Chevy Trax up 16%.
GM said its highest-volume vehicles were broadly in line with an elevated year earlier level. That stability is worth noting for the margin.
Analysts Remain Bullish but Are Trimming
Most price targets are still above the current price. JPMorgan reduced its target to $110 from $120 on October 12th and retained its Overweight rating. UBS also reduced its target, to $112 from $114 and retained its Buy rating. The average price target is $101, about 21% above Thursday’s closing price.
General Motors Technical Analysis: GM Presses Against $84.62 Triangle Resistance as Buyers Regain Control
On the 4-hour chart, General Motors (GM) is at $83.67, -0.06% on the day, and coiling in a symmetrical triangle. Upper and lower trendlines touching around $91.67 and $76.51, respectively, frame this triangle. The rebound from $76.51 was strong, off the lower trendline. Since, the price has risen and reclaimed the blue and red moving averages at $83.02 and $82.65, respectively. The troughs in the moving average convergence/divergence (MACD) histogram suggest the bulls are in control for the time being, and the recent surge in price is unlikely to reverse.
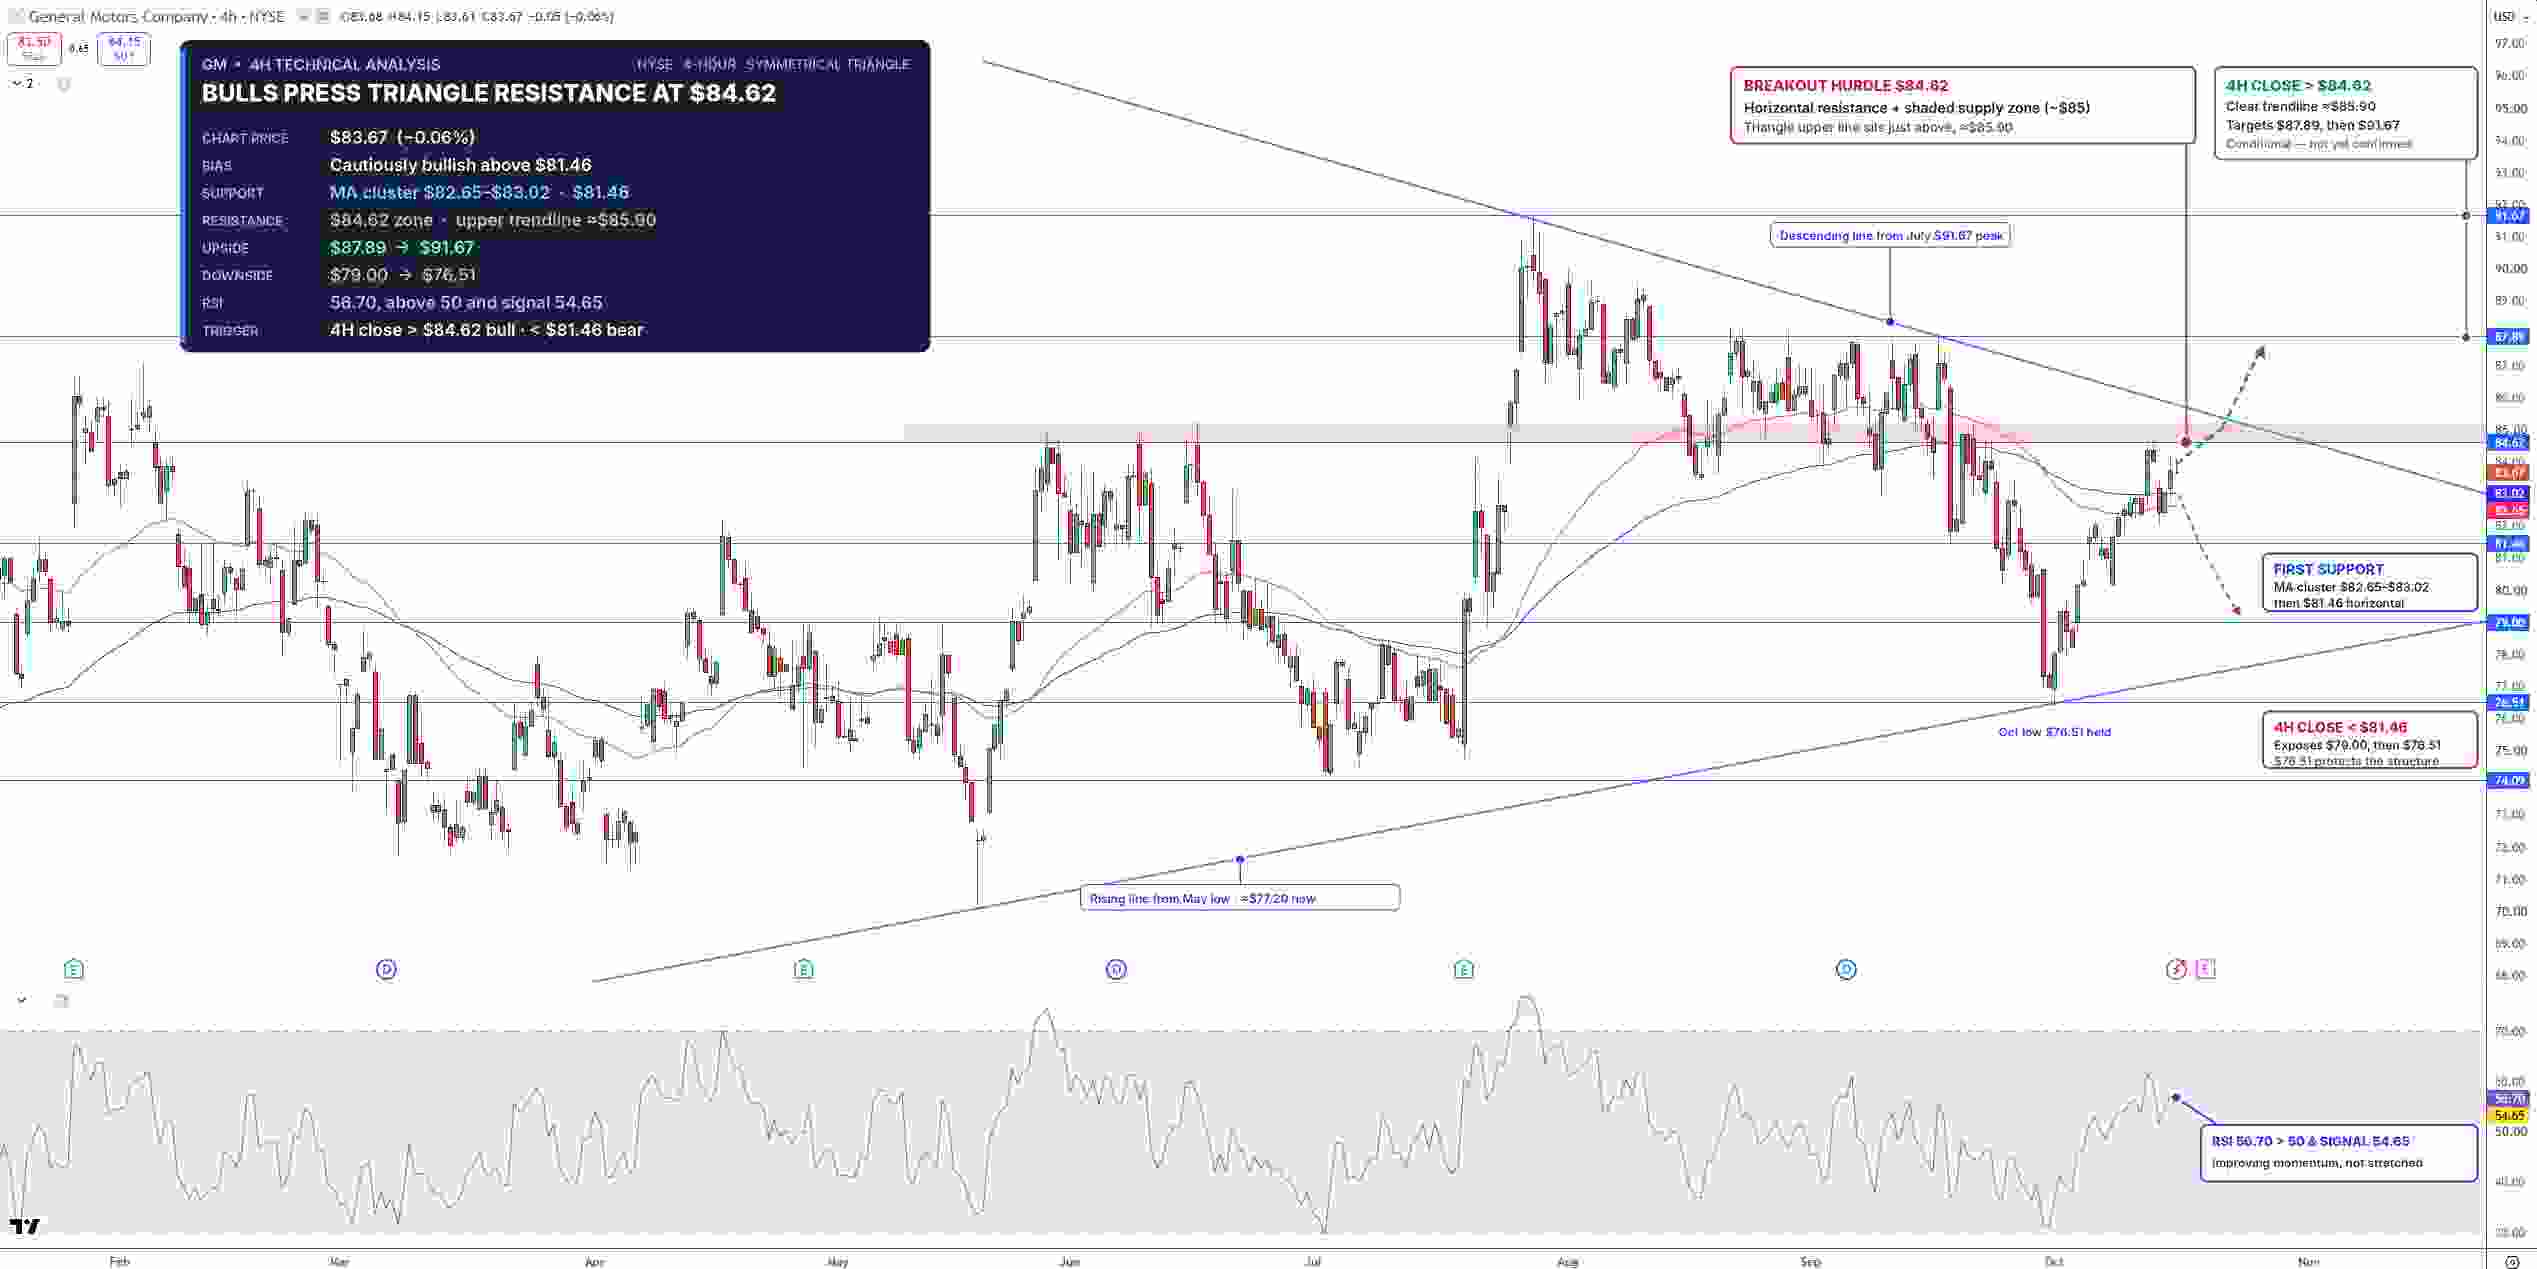
General Motors Stock Price Chart - Source: Tradingview
GM’s 4-hour Relative Strength Index (RSI) sits at 56.70. The RSI is bullish as the 50 midline is below it, and the signal line is also bullish as it is above the midline. With the midline and signal line aligned, the RSI suggests further gains are possible without being overextended.
The large, round number of $85 horizontally resists the trendline in the same area. Above $85, the next major resistance is $87.89, and $91.67 beyond that. The major support is $81.46, $79.00 below that, and $76.51 at the lower end of the triangle.
Above $81.46, I am bullish, and would add to my position if the price broke out to the upside. A buy-the-dip is warranted. I am targeting the mid-$80s to $85 horizontally. The $76 support zone is potential target support. Tuesday’s earnings may move price in that direction.
Key Levels
Last close: $83.66, +0.73% on October 15
Support: $82.65 to $83.02, $81.46, $79.00, $76.51
Resistance: $84.62, $87.89, $91.67
RSI: 56.70, above its 54.65 signal line
Bullish trigger: 4-hour close above $84.62
Bearish trigger: 4-hour close below $81.46
FAQs
When does General Motors report Q3 2026 earnings?
GM will release Q3 results before the market opens on Tuesday, October 20, at approximately 6:30 a.m. ET. Investors will listen for the company’s outlook for the full year.
What is the GM stock forecast heading into earnings?
The bias is bullish above $81.46. A break above $84.62 targets $87.89 and $91.67, and a close below $81.46 indicates a drop toward $79.00.
Bottom Line
GM has a good case heading into next week, benefiting from strong truck sales, falling effect of tariffs, and chart pattern suggesting a breakout. I’ll look for the company to raise its outlook for a third time. If GM reports a third outlook raise and rallies, I’ll look for longs to test the $87.89 resistance. If we get a flat outlook, sell off, and/or new tariff concerns, I’ll take profits and look for the downside toward $79. A close above $84.62 would give me more confidence in my bullish view, and a close below $81.46 would indicate a bearish view.
Recommended Articles


