




Morgan Stanley Q2 2026: Record Revenue $21.35B (+27%), EPS Surge 62%, ROTCE 26.6%, $1.5T Infrastructure Initiative
TradingKey - Morgan Stanley (MS) reported an unprecedented $21.35 billion in revenue for Q2 2026 ($16.79B) (+27% YoY). Net income reached a record $5.58 billion, approximately 60% higher than the $3.5 billion reported in Q2 2025. Diluted EPS reached a record high of $3.46 (+62% YoY). Return on tangible common equity reached an astonishing 26.6%, while return on equity was 20.7%. The sharp decline in the efficiency ratio from 71% to 65% shows impressive operating leverage. Respective revenues of Institutional Securities and equities grew to record highs of $11.04 billion and $6.30 billion (+69%), respectively. Wealth Management reported record revenues of $8.86 billion (+14%) with a record $148.1 billion in net new assets, and fee asset amounts of $3.02 trillion.
Investment Management reported AUM of $2.0 trillion. On August 10, Morgan Stanley officially launched its $1.5 trillion US Innovation Infrastructure Initiative (a 10 year capital raising/advisory service infrastructure initiative for technology and infrastructure). Dividend increase to $1.15/share, and a new $20 billion buyback program authorized for Q3+. Client assets under management for both wealth and investment management combined exceeded $10 trillion for the first time, reaching a significant strategic milestone under CEO Ted Pick.
Institutional Securities: Record $11.04B Revenue, All Three Businesses Contributed
Record $11.04 billion, Institutional Securities all three businesses (advisory, equity and fixed-income underwriting) reached record levels, up 44% YoY. Pre-tax income of $4.3 billion (doubling 2025). Investment banking reached $2.4 billion (+58% YoY). Equities (with record $6.30 billion, +69% YoY) benefited from increased client activity in Asia and spikes in volatility combined with portfolio shifts due to the AI and geopolitical themes. Fixed income increased 13% YoY to $2.46 billion due to strong credit trading and lending of securitized products. The strong backlog indicates continued momentum in Investment Banking for 2027.
Wealth Management: Record $148.1B Net New Assets, 30.5% Pre-Tax Margin
Wealth Management revenue grew to $8.86B (+14% YoY). Pre-tax income was $2.7B or 30.5% pre-tax margin. This is excellent pricing on recurring revenue. Net new assets were a record $148.1B (vs. $59.2BYoY). Half of these inflows were from IPO-related assets in the Workplace channel. Fee-based assets increased to $3.02T from $2.63T. Wealth Management provides a predictable fee stream, while balancing the volatility of investment banking and trading. Its diverified model is working as intended.
Investment Management: AUM $2.0T, Long-Term Flows Positive
Investment Management revenue grew to $1.65B (+6% YoY). AUM improved to $2T from $1.71T YoY, via market appreciation and flows. Long term net inflows were $7.5B. The recurring fee stream helps offset volatility in banking/trading divisions. Along with Wealth Management, the total combined client assets surpass $10T for the first time.
$1.5 Trillion Innovation Infrastructure Initiative (August 10)
Morgan Stanley announced the US Innovation Infrastructure Initiative for the raising and financing of up to $1.5T of capital over a period of 10 years. This will focus on the technologies sectors, as well as the infrastructure and strategic sectors. It is important to note that this is not Morgan Stanley raising $1.5T, but rather providing $1.5T of capital raising services to its clients through their banking and capital markets divisions. If the artificial intelligence and infrastructure spending initiatives continue, fees in the banking and capital markets, private markets, and wealth management divisions will all increase.
Capital Returns: Dividend $1.15, $20B Buyback Authorization
The Board of Directors announced a 15% increase in the quarterly dividend from $1.00 to $1.15. During Q2, they completed a $1.5 billion stock buyback. Additionally, they announced a new $20 billion buyback program to be initiated in Q3 2026. They cited a CET1 capital ratio of 14.8% (strong) to support their decision. They expressed confidence in their ability to return to shareholders while also managing to fuel the company’s growth.
Technical: Support $207.40, Resistance $215, Range-Bound Triangle
MS stock is currently priced at $214.20 based on the technical analysis. It has bounced off the lower boundary of the triangle on August 21. A symmetrical triangle has formed since mid July. The RSI is at 49, placing it in neutral territory against the 50 signal line. The moving averages are $212.41 (long) and $214.77 (short).
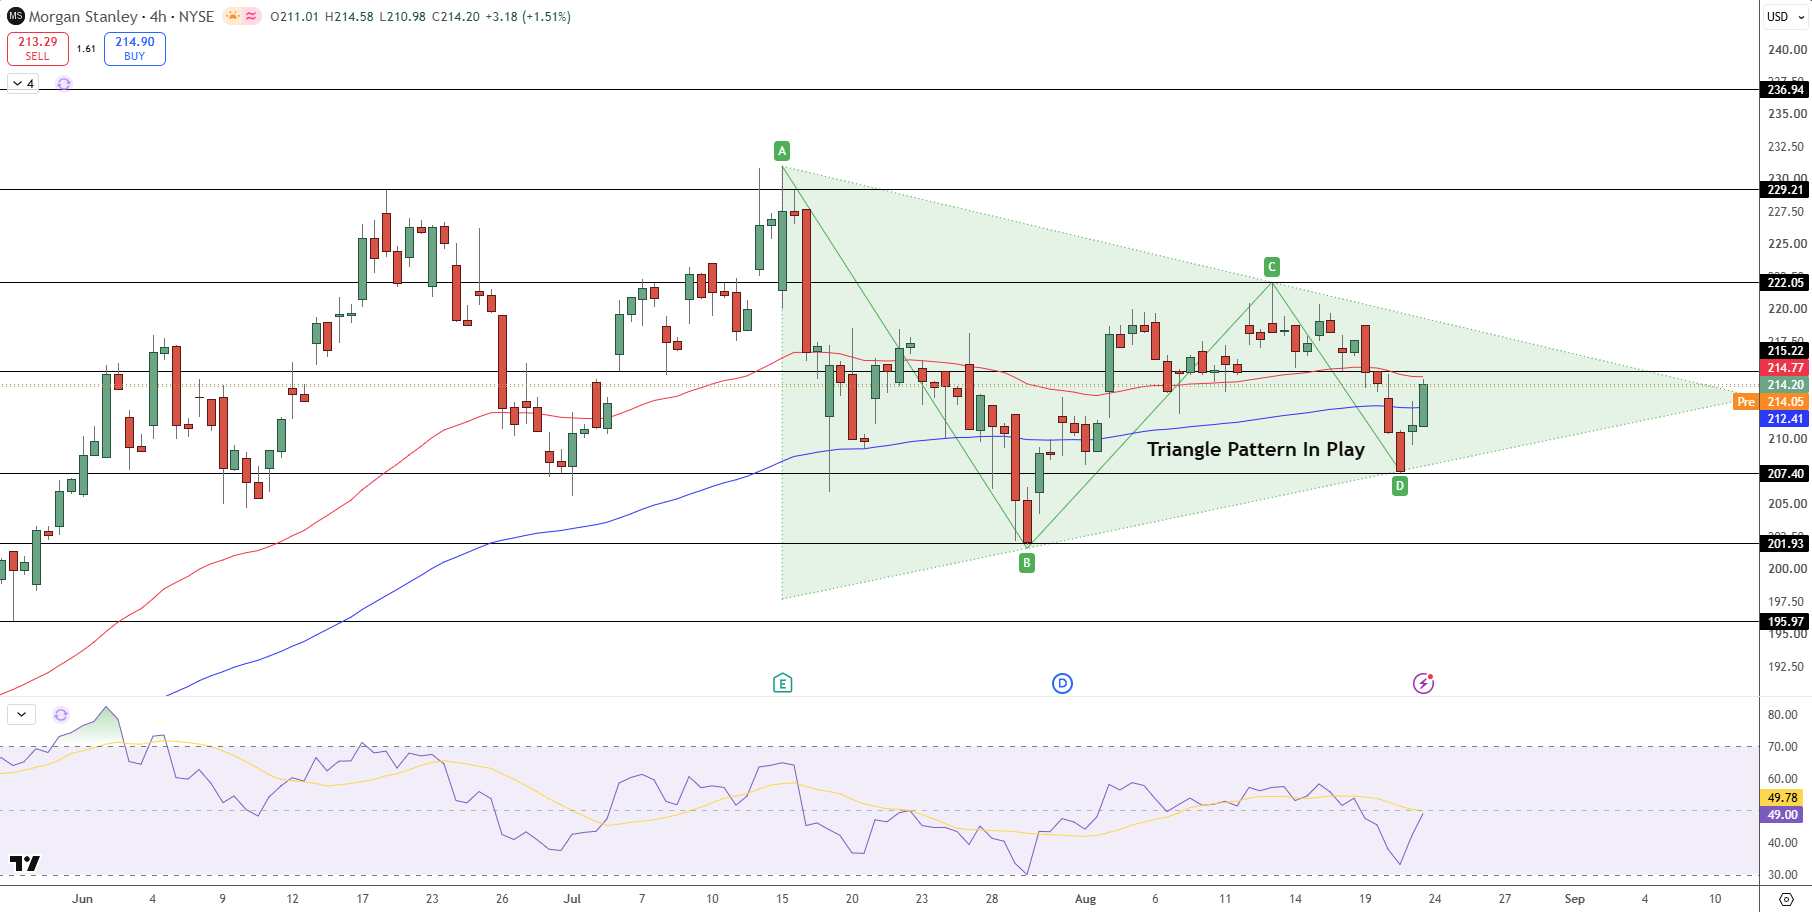
Morgan Stanley Price Chart - Source: Tradingview
The next immediate resistance is at $215.22. A break above will open targets at $222.05 and $229.21. A $207.40 support level will be enforced by the triangle lower boundary. A break below will target at $201.93 and $195.97.
Key Levels
- Support: $212.41 (moving average), $207.40 (triangle boundary), $201.93
- Resistance: $214.77-$215.22 (cluster), $222.05, $229.21
- Bottom Line: Significant Growth in All Segments and Reaching $10 Trillion Client Assets Milestone
Bottom Line: Diversified Model Firing on All Cylinders, $10T Client Assets Milestone
For investors: Morgan Stanley's Q2 highlighted the strength of its integrated model. Best-ever results in equities ($6.3B), unprecedented wealth inflows ($148B), and $2T in AUM create diverse revenue streams in both transactional and recurring revenue. Management’s confidence in operating multiple years of sustained profits is likely supported by the $1.5T Infrastructure Initiative and $20B share repurchase program.
Risks include normalizing trading revenues, an M&A slowdown if interest rates increase, and valuation concerns (currently trading at 18.5x earnings). Technical analysis shows consolidation within a triangle; a break of resistance at $215 would target $222 to $229. A break of support at $207 would diminish the structure. This is analysis, not advice, on investments.
Recommended Articles


