




The Dow Jones Industrial Average sets records while the chips fall
- DJIA carved out a fresh intraday record on Thursday despite a June payrolls print that missed by nearly half.
- The advance looked like rotation out of semiconductors rather than a broad-based rally.
- Rate markets barely touched their Fed hike pricing, keeping a July hold as the base case.
A June jobs report that undershot expectations by nearly half sent the Dow Jones Industrial Average (DJIA) to a fresh intraday record on Thursday, which reads like a contradiction until you look at what actually moved. The blue-chip index added about 0.6% to a new all-time high while the Nasdaq Composite slid and the S&P 500 sat flat. That split is the whole story, because this was rotation rather than a broad wave of buying.
The chips are where the money left
The tell sat in the semiconductor complex, which fell for a second straight session and dragged the tech-heavy benchmarks down with it. Chip names shed several percent as a group, with a pair of equipment makers off close to 8% and heavyweights like Nvidia and Micron following them lower. The read from the desk is a revaluation of the artificial intelligence trade itself rather than simple profit-taking; if companies grow more sensitive to the cost of computing power, the whole capital-spending story that justified those valuations comes up for review. Capital did not leave the market on Thursday; it changed neighbourhoods, and the Dow's older and cheaper constituents took the inflow.
A payrolls miss the Fed can shrug off
The June print showed the economy adding just 57K jobs, well shy of the 115K consensus, the sort of number that would normally send traders reaching for rate cuts. It did not play out that way, and the reasons matter. The unemployment rate actually fell to 4.2% against an expected hold at 4.3%, so the household survey told a firmer story than the payrolls headline, and a Federal Reserve (Fed) now led by a chair who treats first-print jobs data as little more than noise until the third revision was never going to lurch on a single soft release.
Rate futures barely flinched on the hiking path even as the headline miss flashed dovish. The odds of a hold at the late-July meeting firmed toward 82%, but that was already the base case, and the pricing further out still leans toward the Fed grinding rates higher rather than cutting them. A labour market softening at the margin, set against a Crude Oil market that keeps sliding and pulling headline inflation lower, is exactly the mix that lets a hawkish Fed sit on its hands without losing face. The two-year Treasury yield eased on the day, which is the market's polite way of saying no hike next month, not cuts are coming.
Records printed on a skeleton crew
The record also deserves an asterisk for when it landed. Thursday closed the last full session of a holiday-shortened week, with US markets shut Friday for Independence Day, and thin liquidity tends to exaggerate moves in both directions. The tape reopens into a heavier slate, with the Institute for Supply Management (ISM) services survey due Monday and the minutes from the Federal Open Market Committee (FOMC) meeting in June landing Wednesday, the latter the first real look at how split the committee was behind its hawkish hold.
Levels to watch
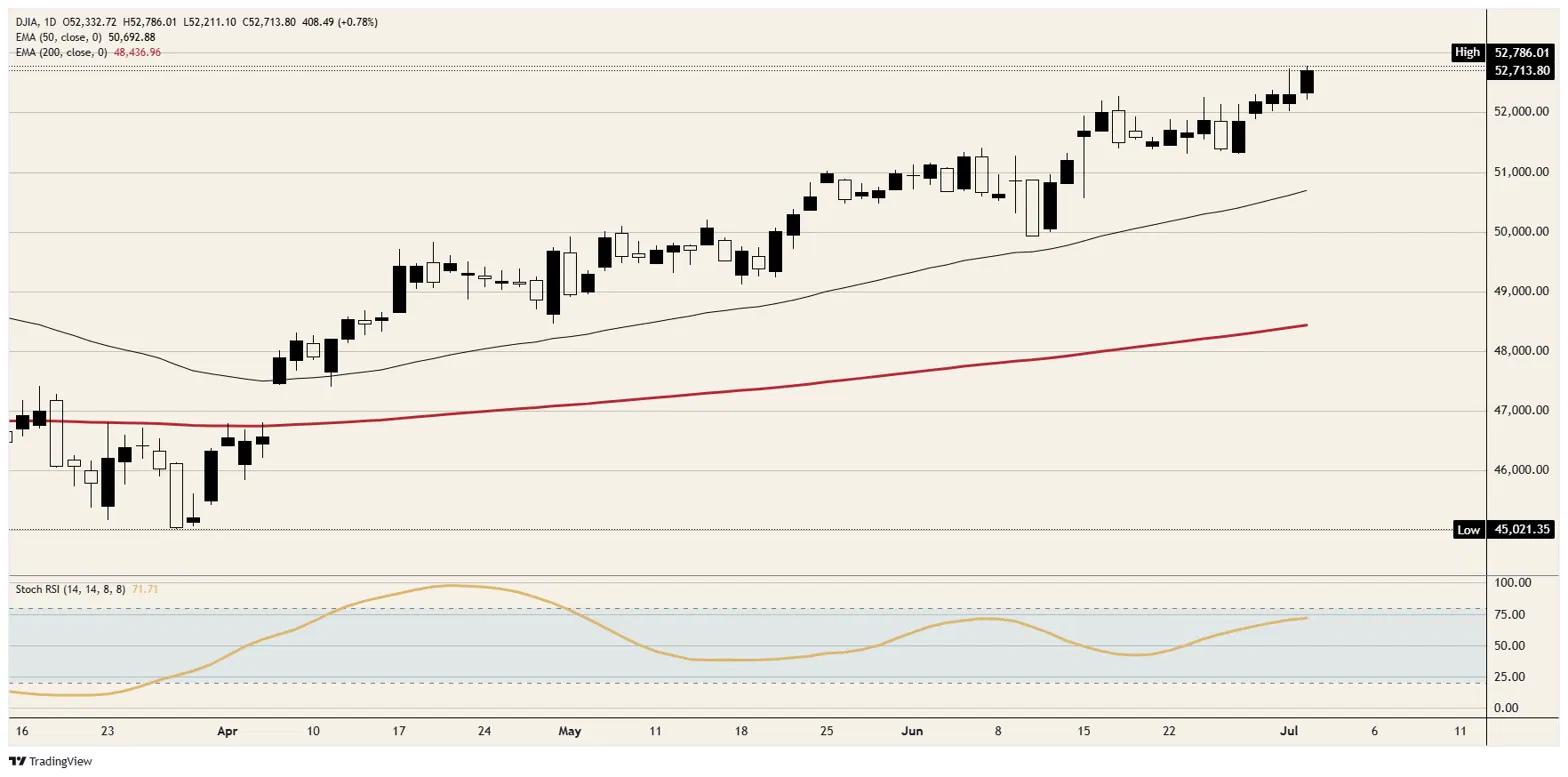
Resistance: The immediate hurdle is the 53,000 handle sitting just above Thursday's high, a level the index has never traded through and the obvious magnet if the rotation bid persists. Clear it on real volume and there is no overhead supply worth naming, which is the double-edged nature of blue-sky territory.
Support: First support sits at 52,000, with the more meaningful shelf down at 51,000 where the index consolidated through late June. Below that, the 50-period Exponential Moving Average (EMA) near 50,700 has tracked this entire advance and marks the line between a healthy pullback and something that needs explaining; the 200-period EMA down near 48,400 is the deeper backstop.
Bias: The path of least resistance points higher, with a caveat about how the index is getting there. The trend is intact and momentum still has headroom, with the daily Stochastic Relative Strength Index (Stoch RSI) elevated near 72 rather than pinned at an overbought extreme, so there is no exhaustion signal yet. The catch is that this leg is being carried by rotation out of technology rather than broad participation, which earns the record respect but not full conviction until the rest of the tape joins in. The stance stays long while price holds above 52,000 and the 50 EMA, and a daily close back below that shelf would signal that the rotation trade has run its course.
Dow Jones daily chart
Dow Jones FAQs
The Dow Jones Industrial Average, one of the oldest stock market indices in the world, is compiled of the 30 most traded stocks in the US. The index is price-weighted rather than weighted by capitalization. It is calculated by summing the prices of the constituent stocks and dividing them by a factor, currently 0.152. The index was founded by Charles Dow, who also founded the Wall Street Journal. In later years it has been criticized for not being broadly representative enough because it only tracks 30 conglomerates, unlike broader indices such as the S&P 500.
Many different factors drive the Dow Jones Industrial Average (DJIA). The aggregate performance of the component companies revealed in quarterly company earnings reports is the main one. US and global macroeconomic data also contributes as it impacts on investor sentiment. The level of interest rates, set by the Federal Reserve (Fed), also influences the DJIA as it affects the cost of credit, on which many corporations are heavily reliant. Therefore, inflation can be a major driver as well as other metrics which impact the Fed decisions.
Dow Theory is a method for identifying the primary trend of the stock market developed by Charles Dow. A key step is to compare the direction of the Dow Jones Industrial Average (DJIA) and the Dow Jones Transportation Average (DJTA) and only follow trends where both are moving in the same direction. Volume is a confirmatory criteria. The theory uses elements of peak and trough analysis. Dow’s theory posits three trend phases: accumulation, when smart money starts buying or selling; public participation, when the wider public joins in; and distribution, when the smart money exits.
There are a number of ways to trade the DJIA. One is to use ETFs which allow investors to trade the DJIA as a single security, rather than having to buy shares in all 30 constituent companies. A leading example is the SPDR Dow Jones Industrial Average ETF (DIA). DJIA futures contracts enable traders to speculate on the future value of the index and Options provide the right, but not the obligation, to buy or sell the index at a predetermined price in the future. Mutual funds enable investors to buy a share of a diversified portfolio of DJIA stocks thus providing exposure to the overall index.
Recommended Articles


